


You're sitting across from an investor, buyer, or promising hire, and they ask the question founders dread: “What's the company worth?” Your spreadsheet says one thing, a recent deal says another, and your gut says the business is worth more because you've spent years building it. Unfortunately, buyers don't pay extra for sleepless nights.
The right answer depends on the decision in front of you. How to calculate a company's valuation for a fundraise isn't the same exercise as pricing equity for an employee, preparing for a sale, or settling a shareholder dispute. The method matters, but the assumptions and context matter more.
A founder usually needs a valuation number at an inconvenient moment. You're raising capital, hiring a senior operator, or receiving an acquisition offer, and suddenly everyone wants a precise answer. The business hasn't changed overnight, but the question has.
A SaaS company might be judged on recurring revenue and growth in a fundraising conversation. The same company may face a much harsher examination from an acquirer focused on customer retention, normalized cash flow, and integration risk. An employee equity grant has a different purpose again. It needs a defensible common-stock value, not a heroic exit fantasy.
The number follows the decision.
Business valuation generally falls into income-based, market-based, and asset-based approaches. The income approach values future cash flows, the market approach compares the business with similar public companies or transactions, and the asset approach focuses on net assets rather than earnings power, as outlined in this overview of business valuation approaches.
Relative valuation has been around far longer than most founders realize. Multiples analysis was understood in the 1800s, U.S. courts used it widely during the 20th century, and comparable company analysis became more systematic at Harvard Business School in the 1930s. Today, analysts still use price-to-earnings, EV/EBITDA, and EV/revenue multiples, often with databases such as Bloomberg, Capital IQ, and FactSet.
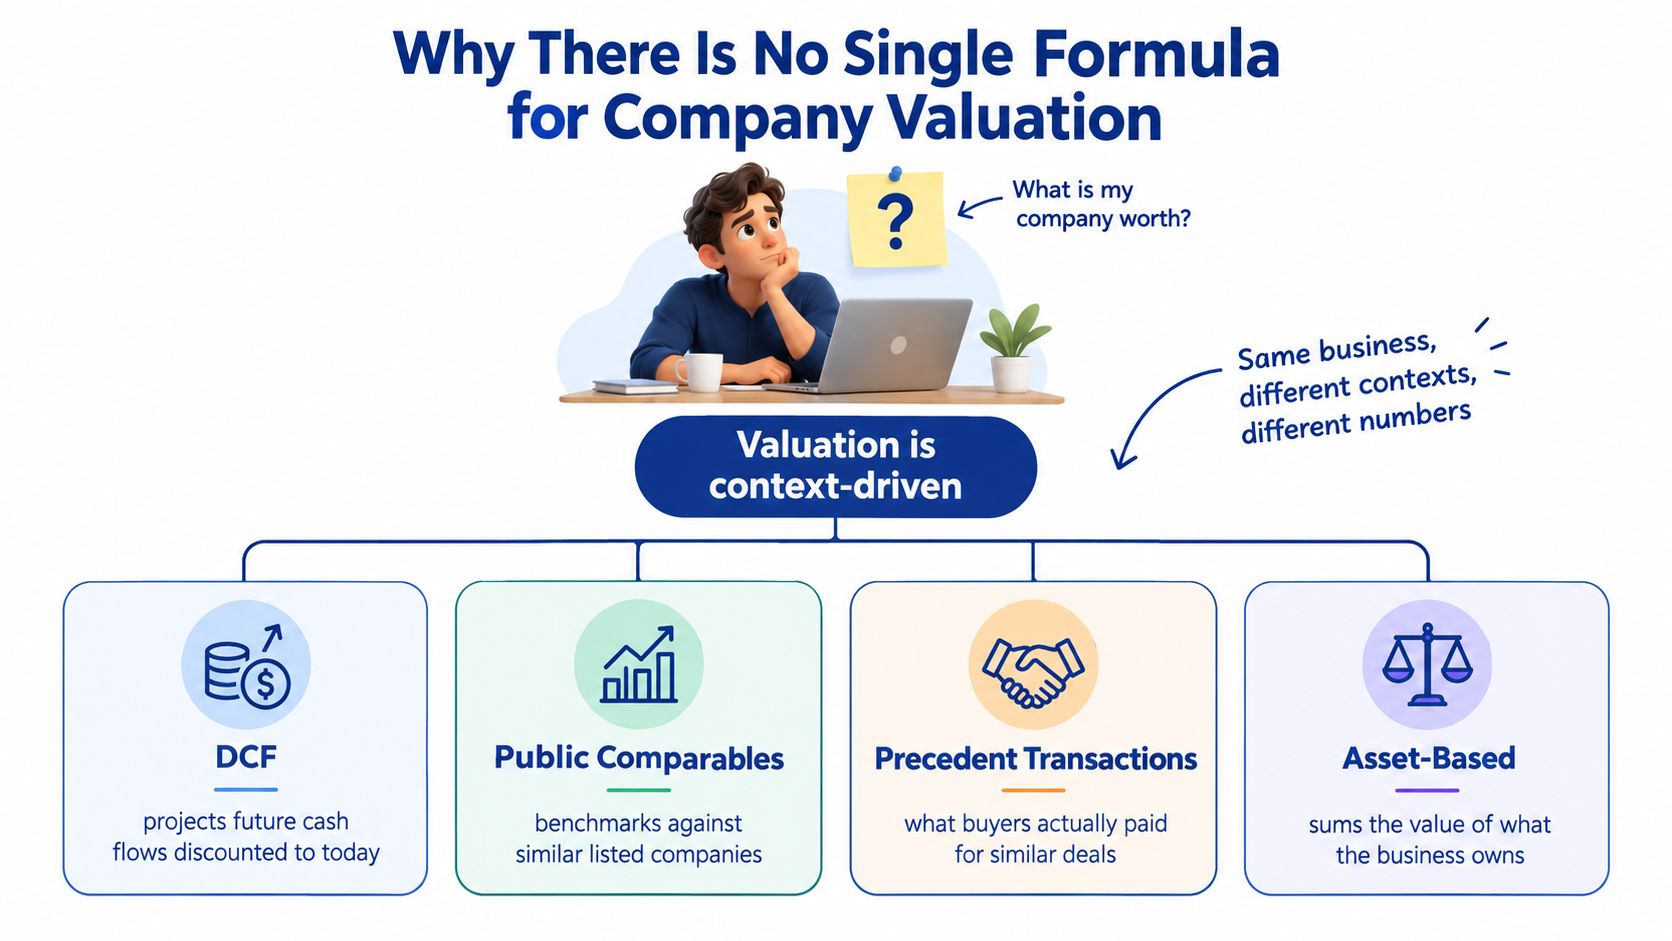
For a US startup or SMB, I rank the methods this way:
They aren't interchangeable textbook chapters. A buyer, investor, and founder may all look at the same business and assign different weight to future cash flow, public comparables, and recent M&A premiums. Your job isn't to find a magical formula. It's to build a range you can defend when someone starts attacking the assumptions.
DCF is the best intrinsic valuation method when your forecast has a connection to reality. It estimates future cash flows, discounts them back to today, and adds a terminal value for the period beyond the forecast. In plain English, it asks, “What are tomorrow's dollars worth right now?”, which is the core idea explained in this DCF valuation guide from Harvard Business School.
Start with unlevered free cash flow, because you're valuing the whole business before financing choices:
FCF = EBIT minus taxes minus reinvestment
Reinvestment includes capital expenditures and the working capital required to support growth. EBITDA is not free cash flow. It skips taxes, working capital, and capex, which is why a business can report attractive EBITDA while producing very little cash.
For an illustrative SaaS company with $10 million in current revenue, assume revenue grows, operating margins improve, and reinvestment remains necessary. The following figures are teaching assumptions, not market data or a prediction.
| Year | Revenue | FCF | Discount Factor | Present Value |
|---|---|---|---|---|
| 1 | $12.0M | $1.2M | 0.893 | $1.07M |
| 2 | $14.4M | $1.8M | 0.797 | $1.43M |
| 3 | $17.3M | $2.6M | 0.712 | $1.85M |
| 4 | $20.8M | $3.5M | 0.636 | $2.23M |
| 5 | $25.0M | $4.5M | 0.567 | $2.55M |
The discount factor comes from 1 divided by (1 + WACC) raised to the relevant year. Here, the illustrative WACC is 12%, so Year 1 uses 1 divided by 1.12, Year 2 uses 1 divided by 1.12 squared, and so on.
For a clean model, document revenue growth, gross margin, operating margin, taxes, capex, and working capital separately. A founder who types one cheerful cash-flow line into a spreadsheet hasn't built a DCF. They've decorated a guess. A more disciplined financial forecasting and business planning process keeps the operating assumptions visible.
WACC blends the required return on equity with the after-tax cost of debt, weighted by the company's capital structure. The equity side commonly starts with a risk-free rate, adds an equity risk premium multiplied by beta, and may include a size premium and company-specific risk adjustments.
For this illustrative model, assume a risk-free rate of 3%, an equity risk premium of 6%, a beta of 1.2, and a size premium of 3%. That produces an illustrative cost of equity of 13.2% before considering debt. The actual WACC depends on the company and the market data available at the valuation date.
The trap is using a public-company discount rate for a small private business. A private company with customer concentration, key-person dependence, uneven earnings, or weak reporting usually deserves more risk than a liquid public peer. If your WACC is suspiciously low, the spreadsheet may be doing emotional support rather than valuation.
Using the Gordon growth model, terminal value equals the next period's free cash flow divided by WACC minus the perpetual growth rate. If Year 5 FCF is $4.5 million, the next year's FCF is $4.725 million under a 5% illustrative terminal growth assumption. With a 12% WACC, the terminal value is $67.5 million before discounting it back to today.
The present value of the explicit forecast in the table is about $9.1 million. The discounted terminal value is about $38.3 million, producing an illustrative enterprise value of approximately $47.4 million. A reasonable DCF range might sit below or above that figure after testing different growth, margin, and WACC assumptions.
Cross-check the result with an exit multiple. If the implied terminal EV/EBITDA looks absurd compared with relevant peers, your DCF is telling you something. Usually, it's telling you that the terminal assumptions are too optimistic.
If you're raising a round or trying to understand what buyers might pay, start with multiples. They're quick, familiar, and grounded in what investors and acquirers use. They're also easy to misuse, especially when founders grab a glamorous public-company multiple and apply it to a much smaller business.
Enterprise value is not equity value. EV adds debt and other liabilities to equity value, then subtracts cash and investments, as explained in this guide to valuing private companies. That distinction matters because EV/EBITDA compares the whole business without letting financing structure distort the comparison.
Screen comparables by:
The following is an illustrative comparison table, not a report of actual public-company data.
| Comparable | EV/Revenue | EV/EBITDA | Growth % | Margin % |
|---|---|---|---|---|
| Comparable A | 3.0x | 8.0x | 12% | 20% |
| Comparable B | 4.0x | 10.0x | 18% | 24% |
| Comparable C | 5.0x | 12.0x | 25% | 28% |
Suppose an industrial business generates $25 million of EBITDA and you apply an illustrative 7x EV/EBITDA multiple. The enterprise value is $175 million. If the company carries $30 million of debt and $5 million of cash, net debt is $25 million, leaving illustrative equity value of $150 million.
That calculation is tidy. The negotiation won't be.
Precedent transactions can produce multiples 20% to 30% higher than trading comparables because buyers may pay a control premium and expect synergies. Treat that spread as a transaction feature, not a guaranteed uplift. A strategic buyer may pay more, while a financial buyer may refuse to underwrite the same assumptions.
Adjust the starting multiple for size and growth. A mega-cap peer with deeper management, broader customers, and better access to capital shouldn't set the exact price for your founder-led company. Apply a size haircut when your business carries more concentration or execution risk, and a growth premium only when the growth is durable and profitable enough to survive diligence.
For a useful side trip on how executives communicate operating performance, explore the Artul.ai blog. It's not a valuation model, but it reinforces a point buyers understand well: polished narrative never substitutes for reliable underlying information.
Asset-based valuation earns its keep when the business owns valuable, identifiable assets or when earnings are too unstable to trust. It's often the wrong primary method for a software company with modest physical assets and substantial recurring revenue. Using book value there is like pricing a restaurant by counting the chairs.
The basic calculation is straightforward:
Adjusted net asset value = fair value of assets minus liabilities
Suppose an asset-heavy business has adjusted equipment of $8 million, inventory of $3 million, receivables of $2 million, and liabilities of $5 million. Its illustrative adjusted net asset value is $8 million. That figure can beat an earnings method when the company is underperforming, facing liquidation, or holding assets that buyers can sell or redeploy.
| Method | Best Used When | Key Adjustment |
|---|---|---|
| Book value | Accounting records broadly reflect asset values | Replace old carrying values with fair market values |
| Liquidation value | The business may shut down or break apart | Apply sale discounts and disposal costs |
| Replacement cost | A manufacturer's operating assets are central to earning power | Estimate the cost to recreate productive capacity |
| Sum-of-the-parts | Divisions or assets attract different buyer types | Value each component separately |
The intangibles problem is where simple asset schedules fall apart. Internally developed software, customer lists, brand equity, proprietary data, contracts, and employee know-how may drive value without appearing cleanly on the balance sheet. Goodwill can reflect past deal accounting rather than an asset a new buyer is willing to underwrite.
In the 2026 deal environment, buyers increasingly care about the economic substance behind those intangibles. Recurring revenue, customer lifetime value, retention, data ownership, intellectual property, ESG factors, and human capital can supplement classic income and market approaches, as discussed in this PwC review of valuation trends.
Practical rule: Run an asset-based analysis when assets can be sold, replaced, pledged, or separated. If the company's value disappears when the team and customer contracts leave, focus on cash flow and market evidence instead.
A valuation isn't a single correct number. It's a range assembled from methods that each fail in different ways. DCF can overreact to a terminal assumption. Multiples can import the risk profile of a stronger peer. Precedent transactions can include synergies your buyer won't share with you.
Run all three where the data supports them, then weight the results according to the deal.
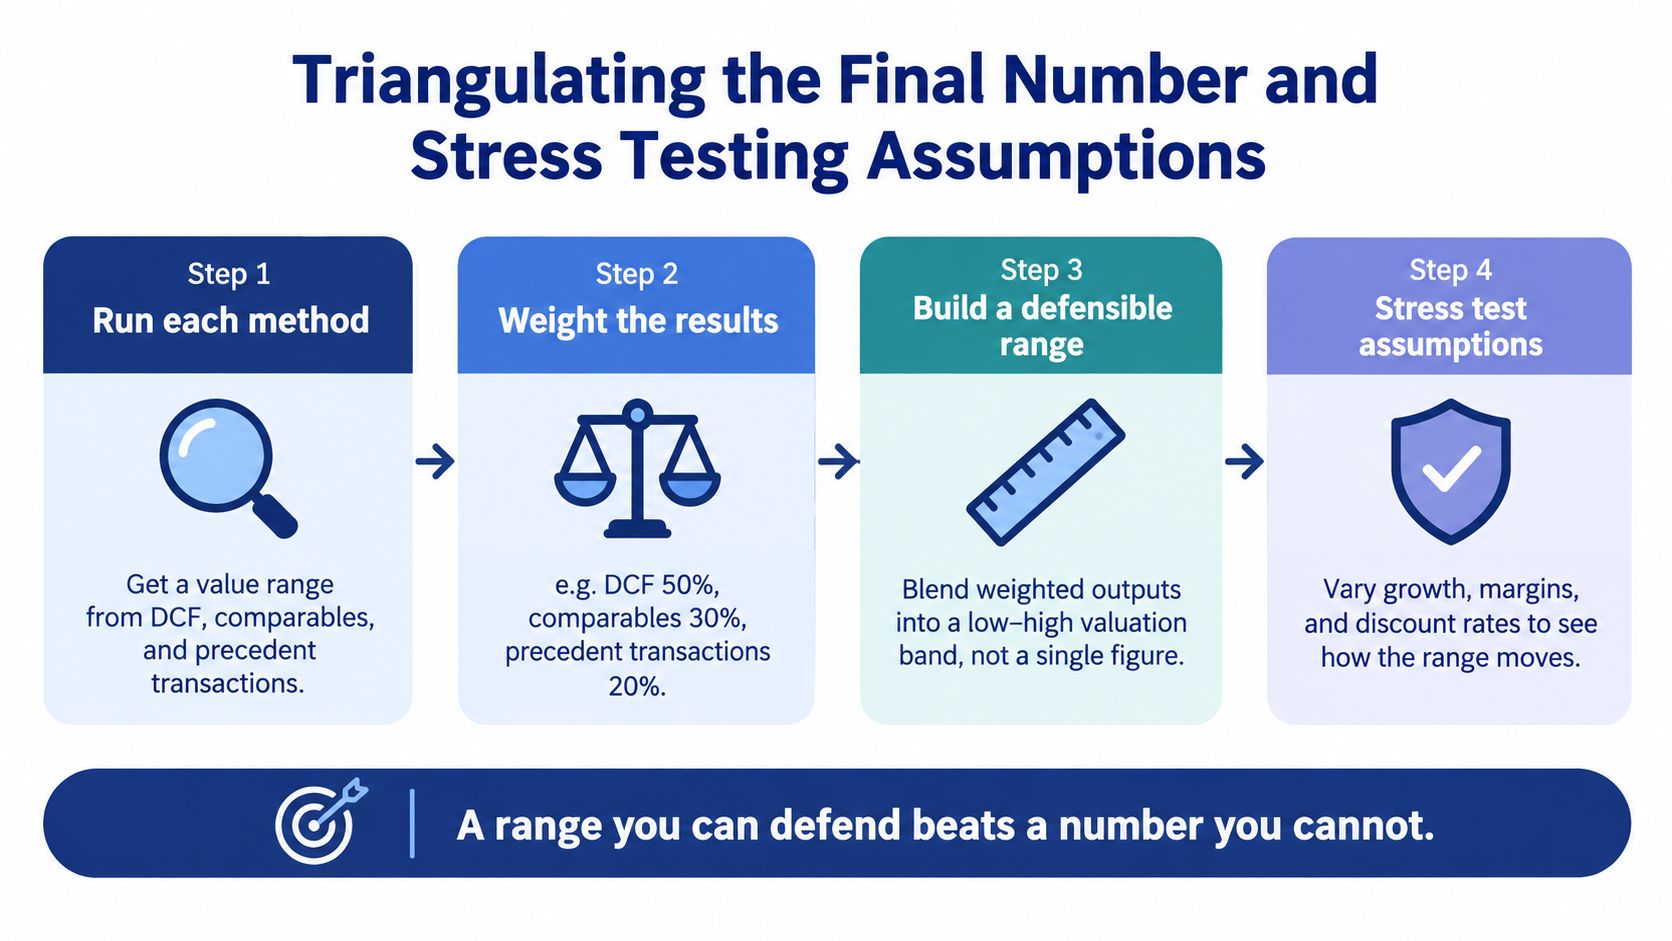
For a business raising a priced round, I'd usually give market comparables the strongest voice, use DCF as a reasonableness check, and use transaction evidence where comparable deals exist. For a sale, precedent transactions deserve more weight because control and buyer behavior matter. For a mature business with dependable cash generation, DCF can take the lead.
An illustrative weighting template might be:
Those weights are a starting point, not a law of finance. Change them when one method has clearly better evidence.
Flex three assumptions independently:
| Variable | Downside Case | Base Case | Upside Case |
|---|---|---|---|
| Revenue growth | Lower assumption | Operating plan | Higher assumption |
| EBITDA margin | Compressed | Base margin | Expanded |
| WACC | Higher rate | Selected rate | Lower rate |
| Terminal growth | Lower rate | Base rate | Higher rate |
A 100 basis point change in WACC or a 200 basis point change in terminal growth can move enterprise value by 15% to 25% in an illustrative DCF, depending on the forecast structure and terminal value contribution. That isn't a universal result. It's a warning about sensitivity. Small changes in the denominator can move a large valuation.
Use a disciplined analysis such as this sensitivity versus scenario analysis framework to separate one-variable tests from complete operating cases. Then document the assumptions someone else will challenge:
A range you can defend beats a number you can't explain.
Small-business valuation often goes wrong before the multiple is ever chosen. The reported EBITDA may include the owner's personal expenses, unusual legal bills, family payroll, or rent that has no relationship to market rates. Applying a multiple to that messy figure produces a precise answer to the wrong question.
Normalize the earnings first.
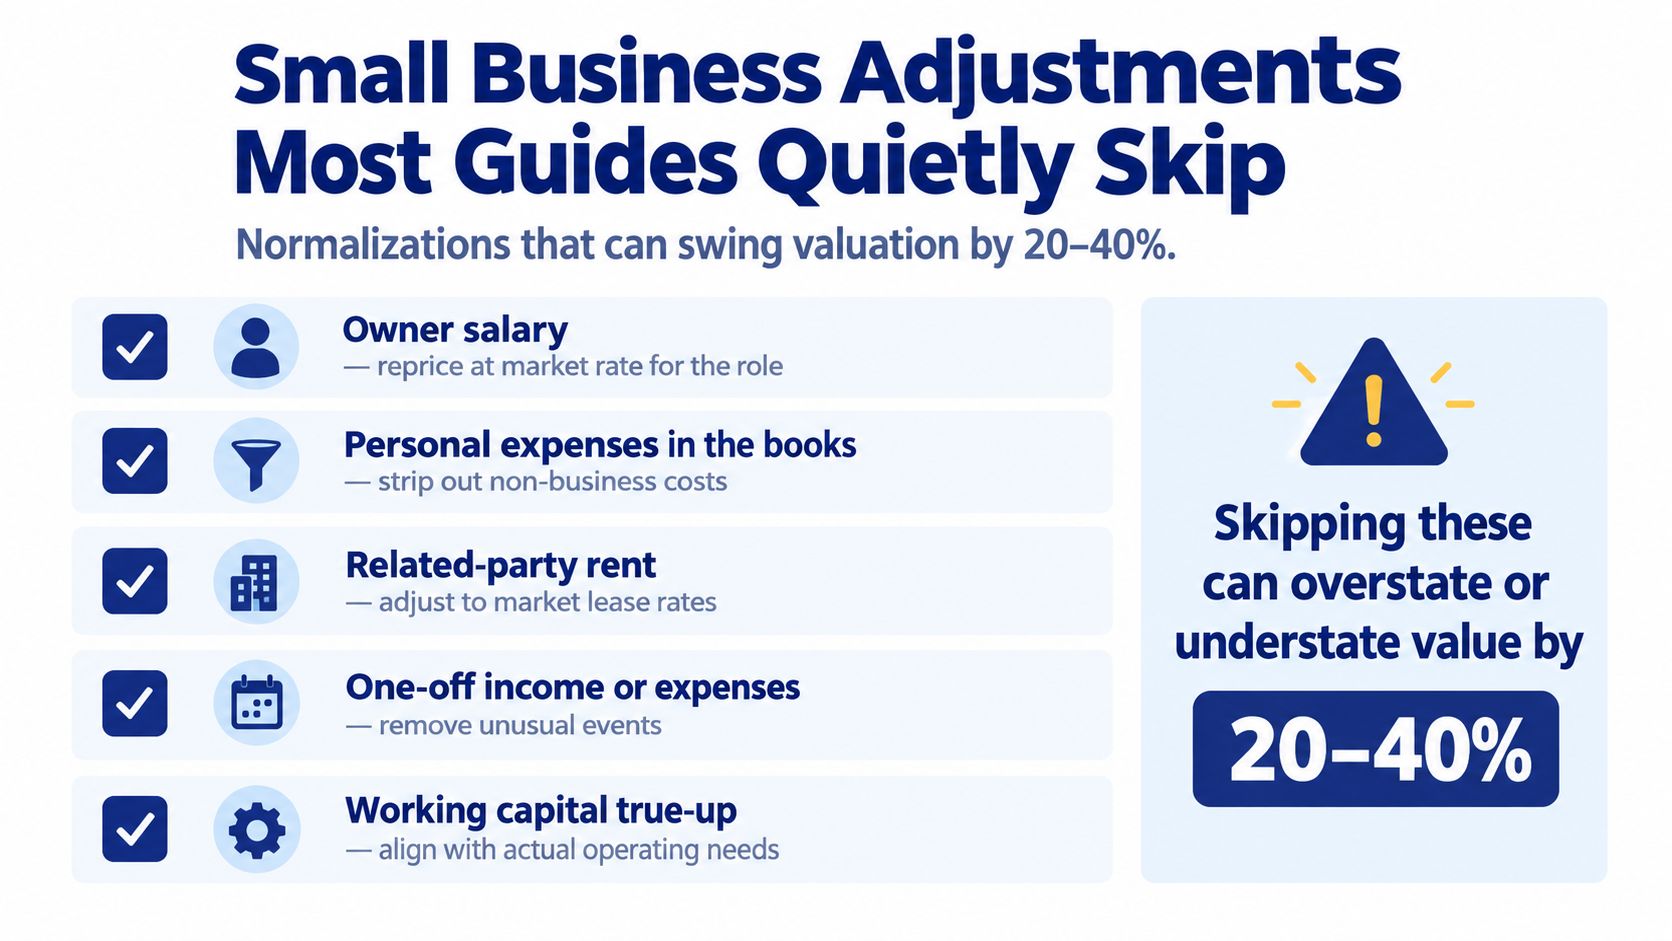
A practical checklist includes:
Suppose a service business reports $800,000 of EBITDA and includes $180,000 of owner perks. Removing those perks produces $980,000 of normalized EBITDA before any rent adjustment. If the current rent is below market, the adjustment will reduce that figure. If it's above market, the adjustment may increase it. The point is to model the business a buyer receives, not the lifestyle the current owner enjoys.
The resulting number affects more than value. Buyers may apply a lower multiple when earnings quality is weak, customer concentration is high, or the owner is irreplaceable. You can reflect those risks directly in the discount rate through a size premium and company-specific premiums for concentration, key-person dependence, and uneven reporting.
The most common shortcut is “earnings times multiple.” It's acceptable for a quick conversation. It isn't enough for a deal.
You can run a useful valuation yourself when the decision is internal and the stakes are limited. Pricing equity for a few hires, testing fundraising dilution, or checking whether an investor's proposed valuation is wildly out of line doesn't require a formal report. Start with multiples, build a rough DCF, and write down the assumptions.
A formal process is justified when the number carries legal, tax, or transaction consequences. Selling the business, raising a priced round above $2 million, resolving shareholder disputes, handling estate work, or preparing a quality of earnings report calls for an independent valuation firm or experienced outsourced CFO team.
| Scenario | DIY Feasible? | Recommended Help | Typical Cost Range |
|---|---|---|---|
| Quick fundraising sanity check | Yes | Founder and finance lead | Varies by internal time |
| Equity pricing for a few hires | Partly | Valuation provider for compliance matters | Varies by scope |
| Sale of the business | No, not alone | Transaction advisor and valuation specialist | Varies by complexity |
| Shareholder dispute or estate work | No | Formal business appraiser and legal counsel | Varies by engagement |
| Quality of earnings preparation | Rarely | Outsourced CFO and accounting team | Varies by scope |
Bring in help if revenue concentration exceeds 25%, the company has multiple entities, recent financial restatements, or an intangible-heavy balance sheet. Those issues create questions that a clean spreadsheet can't answer. They also give a buyer an advantage if you haven't prepared the evidence.
A sensible escalation path looks like this:
For equity planning, Capstacker shares equity insights that can help founders think through ownership and compensation questions before they turn into cap-table arguments. For ongoing modeling and finance capacity, fractional CFO services can provide a practical middle layer between a founder-built spreadsheet and a full advisory engagement.
The method should fit the decision in front of you, not the one with the prettiest spreadsheet. DCF matters when cash flow is forecastable. Multiples matter when market evidence is stronger. Asset value matters when the assets are what buyers can recover.
HireAccountants can help you clean up normalized EBITDA, build forecasts, test valuation assumptions, and support financial due diligence with pre-vetted accounting and finance professionals. Visit HireAccountants when you need practical finance support without immediately building a full in-house team.
Let's simplify your finances today!