


“Use a more advanced model” is popular forecasting advice. It's also a convenient way to avoid asking why sales keeps changing the pipeline definition and nobody can reconcile customer counts to billing.
Financial analyst forecasting starts with method choice, but it holds up through input ownership and disciplined review. A beautiful model won't rescue undocumented assumptions. Before you buy software or hire another analyst, make sure someone can explain where each important number came from and what would make them change it.
A forecast is a guess with a method attached. The method determines how much trust that guess deserves, but inputs and governance determine whether you can use it to make decisions.
Ask for next year's revenue without agreeing on an approach, and you'll get a number from whoever speaks loudest. Usually, that person doesn't own the cash forecast. Convenient.
Forecasting methods compared
| Method | How it builds the number | Best for | Where it breaks |
|---|---|---|---|
| Top-down | Starts from market size or GDP and takes a share | Early sizing and board-level targets | Share assumptions go unchallenged and hide unit economics |
| Bottom-up | Adds up units, customers, headcount, or sales capacity | Operating budgets and hiring plans | Slow to build, and errors compound across many inputs |
| Time-series | Extends historical trend and seasonality | Stable revenue and cost run-rates over short horizons | Misses structural breaks such as a new pricing model |
| Driver-based | Links outputs to conversion, price, churn, and hire dates | Monthly reforecasts and most FP&A planning | Bad driver inputs produce confident wrong answers |
| Scenario and sensitivity | Varies assumptions together or individually | Cash runway and board risk discussions | Ranges are only as wide as the team admits |
| Analyst consensus | Averages external analyst estimates | Public-company benchmarking and near-term checks | Inherits shared bias and can't replace company-specific drivers |
Read that table as a sequence of questions, not a sophistication ladder. Top-down asks whether the opportunity is plausible. Bottom-up asks whether your people and capacity can deliver it. Time-series asks what happens if established patterns continue.
Driver-based forecasting connects operating decisions to financial outcomes. Scenarios expose the consequences of being wrong. Consensus provides an outside comparison, not permission to stop thinking.
For a complementary business-owner perspective, the Bookkeeping and Accounting of Florida insights from Bookkeeping and Accounting of Florida Inc. offer useful context for treating forecasting as planning rather than fortune-telling.
Combine methods instead of declaring a winner. A driver-based revenue forecast with a top-down market-share check gives management both an executable plan and a reasonableness test.
Name the method behind your current forecast. Then ask when anyone last tested it against actuals. If the answer involves a shrug and an impressive Excel chart, start there.
Planning a road trip from the total distance you can cover is top-down. Adding every leg, fuel stop, and hotel stay is bottom-up. Both help, but only one tells you whether you've budgeted for somewhere to sleep.
In forecasting, top-down starts with the addressable market and assumes a share. If the market is measured in potential customers, multiply that customer share by expected net revenue per customer. If it's already measured in dollars, don't multiply by price again.

Say a hypothetical startup assumes 2% of a $4 billion market. That produces $80 million in annual revenue. The percentage sounds polite; the operating requirement may be outrageous.
Who sells it? How long does implementation take? Can customer support absorb those accounts? A market-share assumption doesn't answer any of those questions.
Bottom-up starts with selling capacity: productive reps, ramp dates, qualified opportunities, win rates, and average deal value. Don't multiply quota by win rate if the quota already represents expected closed revenue. That's not conservatism; it's double-counting the same constraint.
Practical rule: Use top-down to challenge the destination. Use bottom-up to fund the journey.
Bottom-up is the stronger starting point when hiring, cash, or delivery capacity is on the line. Its weakness is maintenance: recruiting delays, changing deal sizes, and implementation bottlenecks all need someone to refresh the assumptions.
Build the operating plan, then divide projected revenue by the relevant addressable market. Keep geography, product scope, currency, and period consistent, or the comparison is decorative.
Suppose your hypothetical bottom-up plan implies 15% of a niche market you barely understand. That doesn't automatically make it wrong. It does mean you should investigate duplicated opportunities, unrealistic rep productivity, or a market definition that excludes customers you're counting.
The useful conversation isn't whether leadership prefers ambition or caution. It's which operating assumptions support the target and what evidence would overturn them.
Calculate your implied market share today. Then ask the sales and operations leaders to explain how the company earns it without assuming unlimited demand or frictionless delivery.
Open your monthly actuals chart before opening a forecasting wizard. If revenue repeats a recognizable seasonal pattern and costs move steadily, a time-series baseline can be useful. If the chart contains a pricing overhaul and a lost anchor customer, fitting a smooth line through everything won't make those events repeatable.
Time-series forecasting separates historical observations into trend, seasonality, and unexplained variation. Moving averages smooth short-term fluctuations. Exponential smoothing gives recent observations more weight, which helps when the current operating level matters more than distant history.
As a working setup, use 24 to 36 months of monthly actuals, giving an annual seasonal pattern at least two full cycles to inspect. That's a modeling recommendation, not a guarantee of sufficient history: a young business may have plenty of rows and very little comparable operating history.
Keep the original actuals intact. Flag unusual events separately, fit the baseline, and inspect the residuals, the differences between fitted and actual values. Repeated positive misses around renewals or negative misses after promotions mean you've left useful structure unexplained.
An NBER working paper on analyst expectations finds that subjective forecasts outperform statistical models at short horizons but underperform them at longer horizons, with bias and noise increasing as the horizon extends. That finding doesn't crown time-series models the universal winner; it warns against assuming human judgment remains superior indefinitely.
I'd use time-series as a baseline for one-to-three-month cash and revenue run-rates where operations are stable. Beyond about twelve months, I'd insist on a driver-based comparison rather than approve an extrapolated line on its own. Those are review guardrails, not universal accuracy cutoffs.
Inspect your last three forecast misses. Were they slowly changing trends the model failed to catch, or structural breaks nobody explicitly modeled? The remedies are different. Refitting won't fix an omitted customer cancellation.
A useful driver model lets management change an operating assumption and see the financial consequence. It shouldn't require the analyst to patch several unrelated cells afterward.
The flow is straightforward. The discipline sits inside the assumptions.
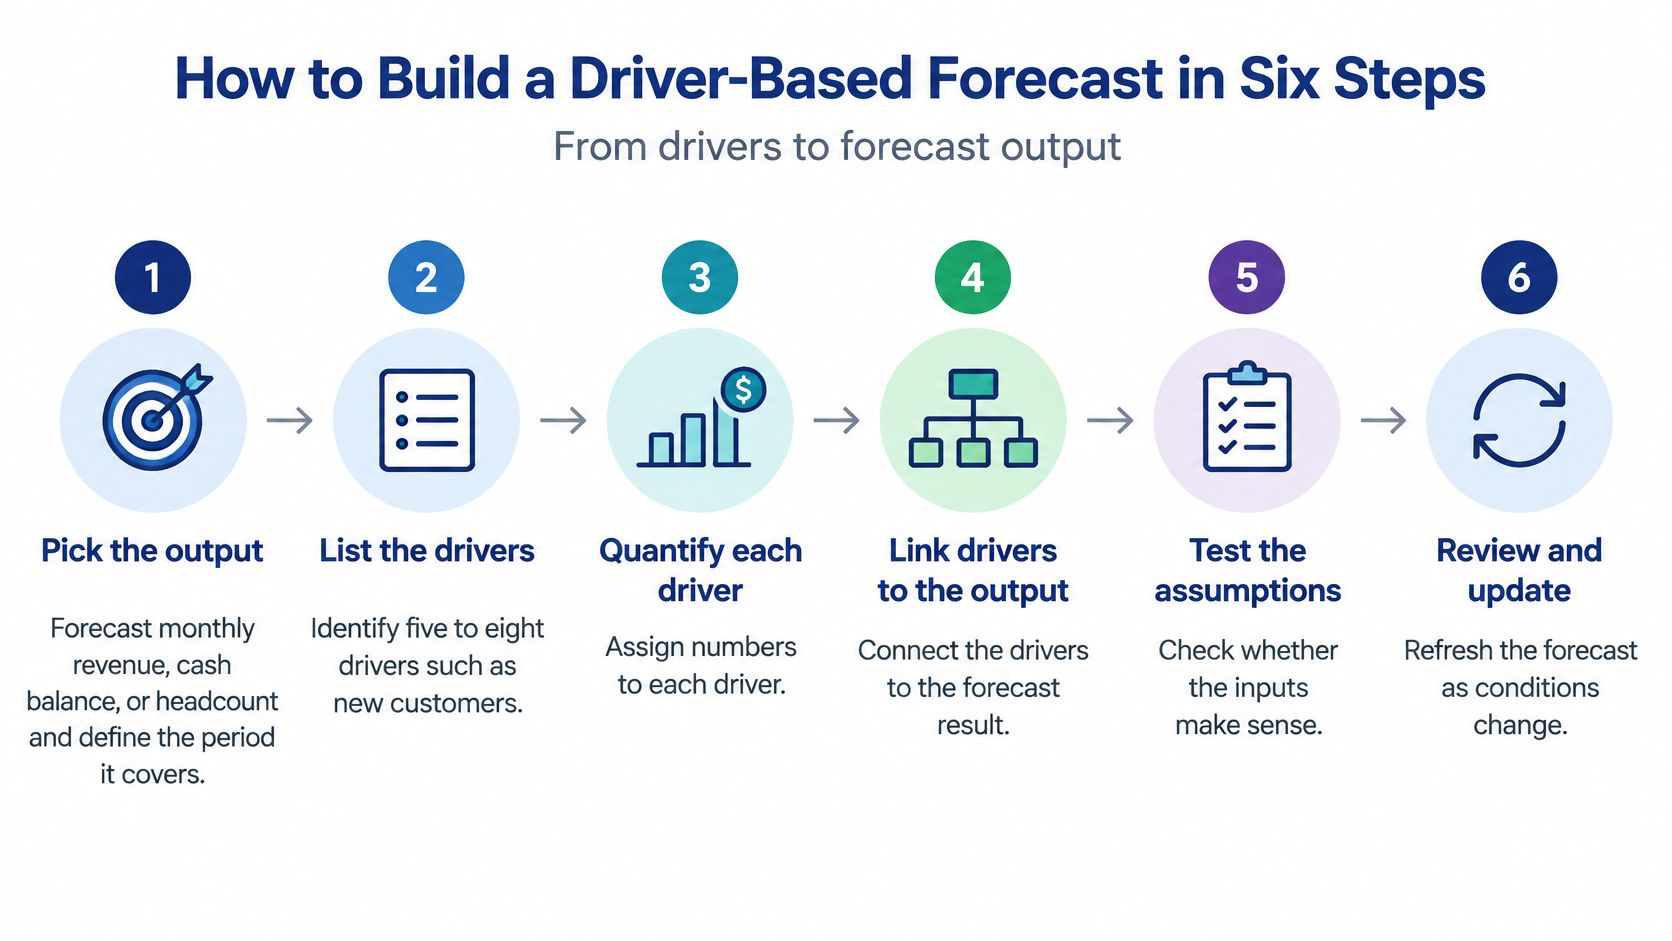
Pick the output and period. Choose monthly revenue, ending cash, or headcount, and label the forecast period explicitly. The common slip is mixing bookings, recognized revenue, and collections as though they're interchangeable.
List the drivers that produce it. Start with roughly five to eight controllable or observable drivers, such as new customers, conversion, net price, churn, hire dates, and compensation. Resist adding every available metric; a driver earns its place by changing the output through a clear relationship.
Quantify each driver from evidence. Use the last twelve months of actuals as a starting window, supplemented by open pipeline and signed contracts where relevant. Mark source dates and distinguish contracted business from probability-weighted opportunities, or someone will count the same sale twice.
Connect inputs with formulas. Revenue can begin with active customers multiplied by net price, with explicit adjustments for timing and recognition; mark hard-coded assumptions in a consistent color and label them. Use price after discounts, and apply churn to the eligible opening customer or revenue base, not indiscriminately to new additions.
Benchmark against comparable peers. Screen for sector, business model, geography, growth, and margin economics, not just familiar logos. CFA Institute's discussion of peer benchmarking reports that a one-standard-deviation increase in average fundamental similarity among analyst-selected peers is associated with approximately 23% better earnings-forecast accuracy, which supports careful peer selection rather than promising the same improvement for your internal model.
Compare the saved forecast with actuals. Reconcile this month's result against the version approved last month, separating volume, rate, timing, and scope differences. Don't overwrite the old forecast before comparing it, unless your preferred accuracy metric is selective memory.
Peer comparisons should challenge your assumptions, not replace them. A comparable company's margins won't tell you when your delayed implementation project will finish or whether your next hire will accept the offer.
Good looks like a controlled dependency chain. Change the hire date, and compensation and productive capacity move appropriately. Nothing else changes without an explainable formula linking it to that decision.
Scenarios change several assumptions together into a coherent story. Sensitivity changes one driver at a time to expose its effect. Combining them gives you both a plausible operating case and a ranked list of what deserves attention.
Consider a hypothetical SaaS company with $5 million in ARR. Every figure below is an illustrative assumption, not an industry benchmark; ARR also isn't a substitute for a recognized-revenue or cash-collection schedule.
Illustrative scenario set for a hypothetical SaaS company
| Scenario | Revenue growth | Gross margin | Monthly burn | Action trigger |
|---|---|---|---|---|
| Base | 12% | 65% | $100,000 | Pipeline converts at the 90-day average |
| Upside | 20% | 70% | $75,000 | Two enterprise deals close before the next quarter |
| Downside | 4% | 60% | $150,000 | Monthly churn stays above 2% for two consecutive months |
The upside assumes operating efficiency improves despite growth investment. The downside combines weaker retention with underused delivery capacity, so margins fall while burn rises. Those relationships matter more than whether the table looks reassuring.
Tie the downside trigger to a hiring pause and a review of discretionary commitments. Tie upside spending to signed contracts and delivery capacity, not an enthusiastic sales update.
The distinction between combined cases and isolated input changes is captured in this comparison.
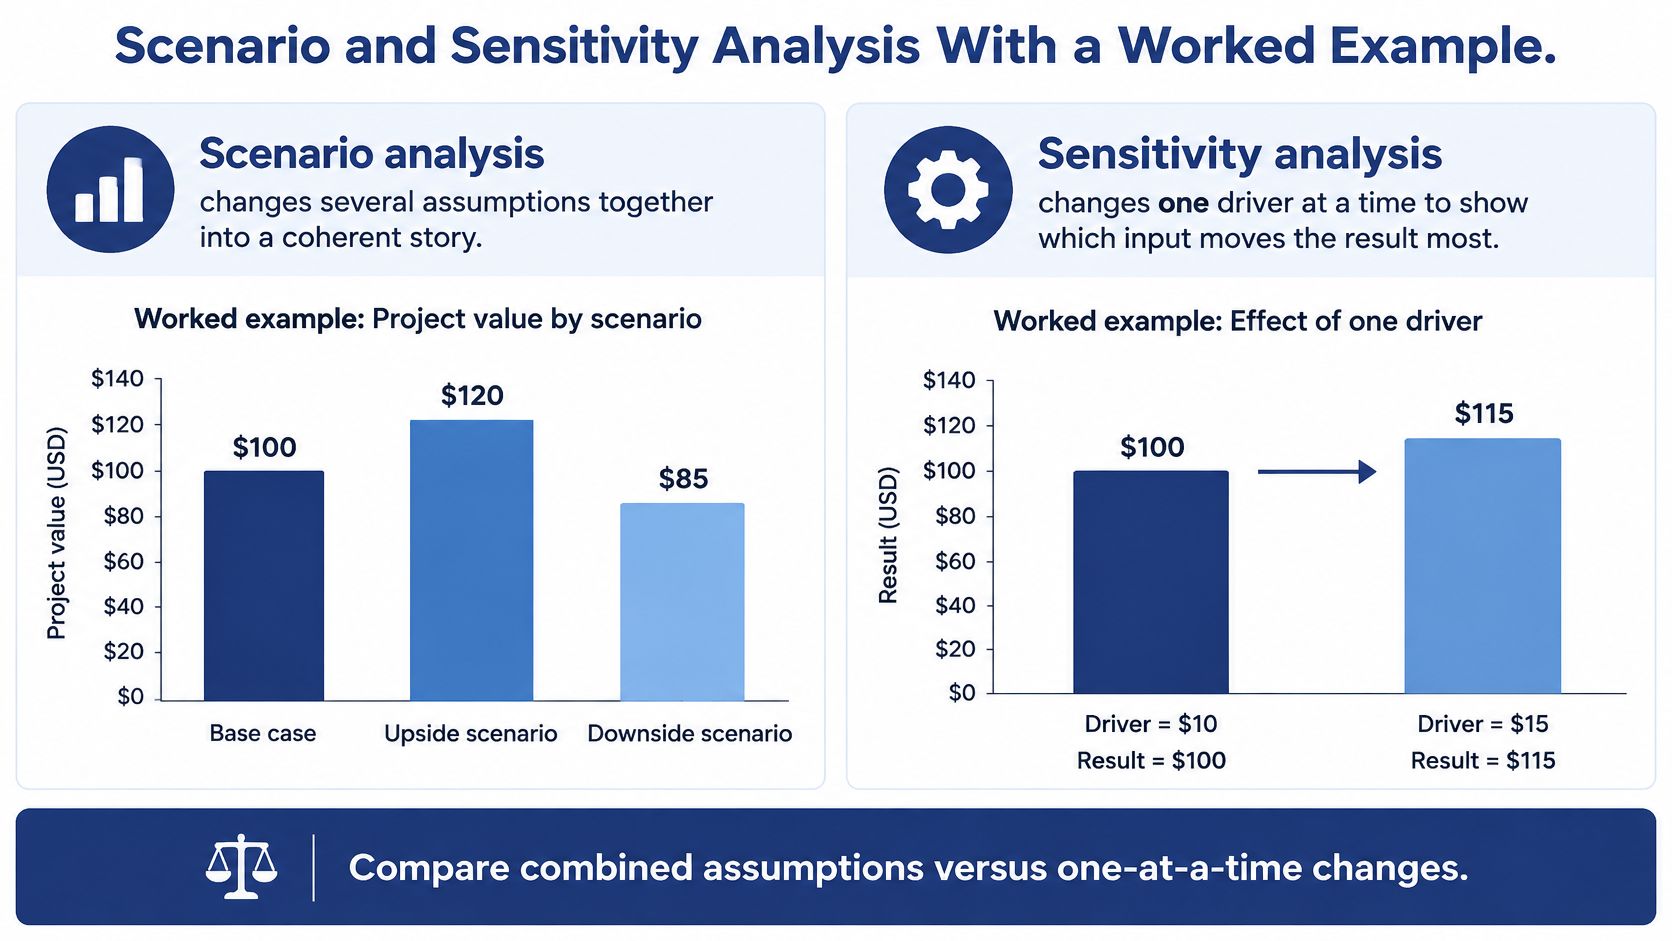
Now reset to base and change churn, sales productivity, net price, and hiring dates individually. Rank the resulting changes in year-end cash. Keep the changes operationally plausible; comparing a tiny price adjustment with a catastrophic retention collapse tells you very little.
Churn and sales productivity deserve close inspection in subscription models, but let the calculated cash effects establish the ranking. Don't assume the prettiest pricing slide contains the most important lever. The practical distinction is also covered in our guide to sensitivity versus scenario analysis.
The downside case should include the outcome you'd be embarrassed to explain leaving out.
A CFA Institute summary of analyst forecast-range evidence reports an individual-company hit rate of only about 40%. That's evidence about earnings forecasts, not a predicted hit rate for your SaaS plan, but it's a useful warning against confident, narrow ranges.
Track whether actuals fall inside your ranges by metric and horizon. If tomorrow's downside trigger fired, which commitment would you stop first?
No tool fixes bad drivers. Pick forecasting software according to the coordination problem you need to solve, not the number of animated dashboards in the demo.
Excel and Google Sheets are useful when someone can inspect the formulas and control the file. An FP&A platform becomes attractive when collecting, approving, and preserving assumptions takes more effort than analyzing them.
Forecasting tools by type and stage
| Tool type | Strength | Weak spot | Fits when |
|---|---|---|---|
| Spreadsheet model | Flexible, cheap, and easy to audit | Version chaos and fragile links | Single-owner models with few contributors and one entity |
| Accounting system reports | Actuals tie directly to the ledger | Weak on scenarios and forward-looking drivers | Historical review and close checks |
| BI dashboard | Clear visuals for leadership | Not a modeling engine | Reporting on top of a finished model |
| Dedicated FP&A platform | Versioning, approvals, and scenario switching | Setup time and licence cost | Several entities or monthly reforecasts with many contributors |
QuickBooks reports can anchor actuals. Power BI can present approved outputs. Neither removes the need to define customer counts, booking dates, collection timing, or who resolves a mismatch between CRM and accounting records.
For AI-assisted workflows, require the same traceability. An analyst should be able to identify the source records behind an outlier and document why management accepted or overrode the model's suggestion. A plausible explanation generated after the fact isn't an audit trail.
I'd assess moving beyond spreadsheets when several legal entities need consolidation, monthly reforecasts involve more than three contributors, or approvals disappear into email. That contributor threshold is a practical screening rule, not a software requirement.
Before migrating, standardize definitions and reconcile the source feeds. Otherwise, you'll pay licence fees to reproduce the same disagreement in a nicer interface.
Bad formulas get blamed too often. The method supplies the first estimate; ownership and cadence decide whether it survives contact with actuals. Faster updates can make optimism worse when founders, sales and finance share the same expectation: each new data point gets read as confirmation, and the number drifts upward with better slides and worse evidence.
A reviewer who only asks for a walkthrough is decoration. The control works when that person can block an upward revision until the input owner produces fresh evidence.
Track signed bias using a consistent convention, such as forecast minus actual, so positive results identify overforecasting. Track mean absolute percentage error, the average absolute error divided by the absolute actual result, to show typical proportional distance from outcomes.
Percentage error becomes misleading when actuals are zero or near zero, particularly for cash balances or small profit figures. Use absolute dollar error alongside it, and document any exclusions.
Connect the log to variance analysis in finance so explanations distinguish changed operating conditions from avoidable modeling mistakes. Review error by month and by owner in the same meeting where management reviews results, because optimism survives when accuracy becomes a separate exercise no one has to attend.
Treat missing input ownership as the first problem to investigate, not a reason to commission a fancier model. An analyst can maintain the forecast, but sales, operations, and hiring managers still need to answer for the assumptions they control.
If you lack capacity, consider fractional FP&A support, training the person closest to the numbers, or hiring a financial analyst. Choose based on the work you need owned, not just a job title.
At HireAccountants, we send a custom shortlist of top pre-vetted candidates for your open position within 24 hours. We arrange interviews with the candidates you choose as soon as possible, and the talent is available to start immediately.
That process can help you add capacity; it can't decide your internal responsibilities. Give the analyst a defined mandate before handing over inconsistent inputs and calling it onboarding.
Which driver would you name an owner for today, and who would you give it to?
HireAccountants connects you with pre-vetted finance professionals who can build driver models, maintain forecasts, and turn variances into useful management decisions. Visit HireAccountants with your forecast's purpose, current tools, and ownership gaps, so you can hire for the work that needs doing.
Let's simplify your finances today!