


Profit margin is profit divided by revenue, multiplied by 100. The profit line you choose determines whether you're calculating gross, contribution, operating, or net margin.
You've got a P&L open, sales look healthy, and someone asks the question that turns a tidy spreadsheet into a debate: “So what's our margin?” The division is easy. The tricky part is deciding which revenue and costs belong in the calculation, and whether they've been recorded in the right period. Get that wrong and the percentage can look impressive while the business is quietly paying for shipping, refunds, or founder labor somewhere else.
The rule is profit divided by revenue, times 100. Pick a different profit line and you get a different margin, because each one answers a different question.
The U.S. Securities and Exchange Commission's guide to financial statements describes how an income statement subtracts cost of sales from net revenue to produce gross profit. For example, $500,000 in revenue minus $300,000 in cost of goods sold (COGS) leaves $200,000 in gross profit. Divide $200,000 by $500,000 and the gross margin is 40%.
Carry that same example down the income statement. If the company reports $100,000 in operating income, its operating margin is 20%. If it reports $60,000 in net income, its net margin is 12%. Same company, three percentages, and none of them is wrong. Each measures a different stage of the business.
| Margin type | Formula | Decision it supports | SEC example result |
|---|---|---|---|
| Gross margin | (Revenue − COGS) ÷ Revenue | Pricing and direct-cost economics | 40% |
| Contribution margin | (Net revenue − variable costs) ÷ Net revenue | Per-sale and product-level decisions | Depends on variable costs |
| Operating margin | Operating income ÷ Revenue | Core operations after overhead | 20% |
| Net margin | Net income ÷ Revenue | What owners ultimately keep | 12% |
Use gross margin to test pricing and direct costs. Use operating margin to see what's left after overhead, and net margin to understand what remains after interest, taxes, and other applicable costs. Contribution margin is the one many founders skip, even though it can reveal whether a sale actually earns its keep after sale-specific costs such as shipping, packaging, and commissions.
If you're checking what belongs in COGS, this guide to calculating cost of goods sold can help you build a consistent definition. Whatever margin you report, make sure the numerator and denominator cover the same period and use the same revenue definition. A margin without a named profit line is an incomplete answer.
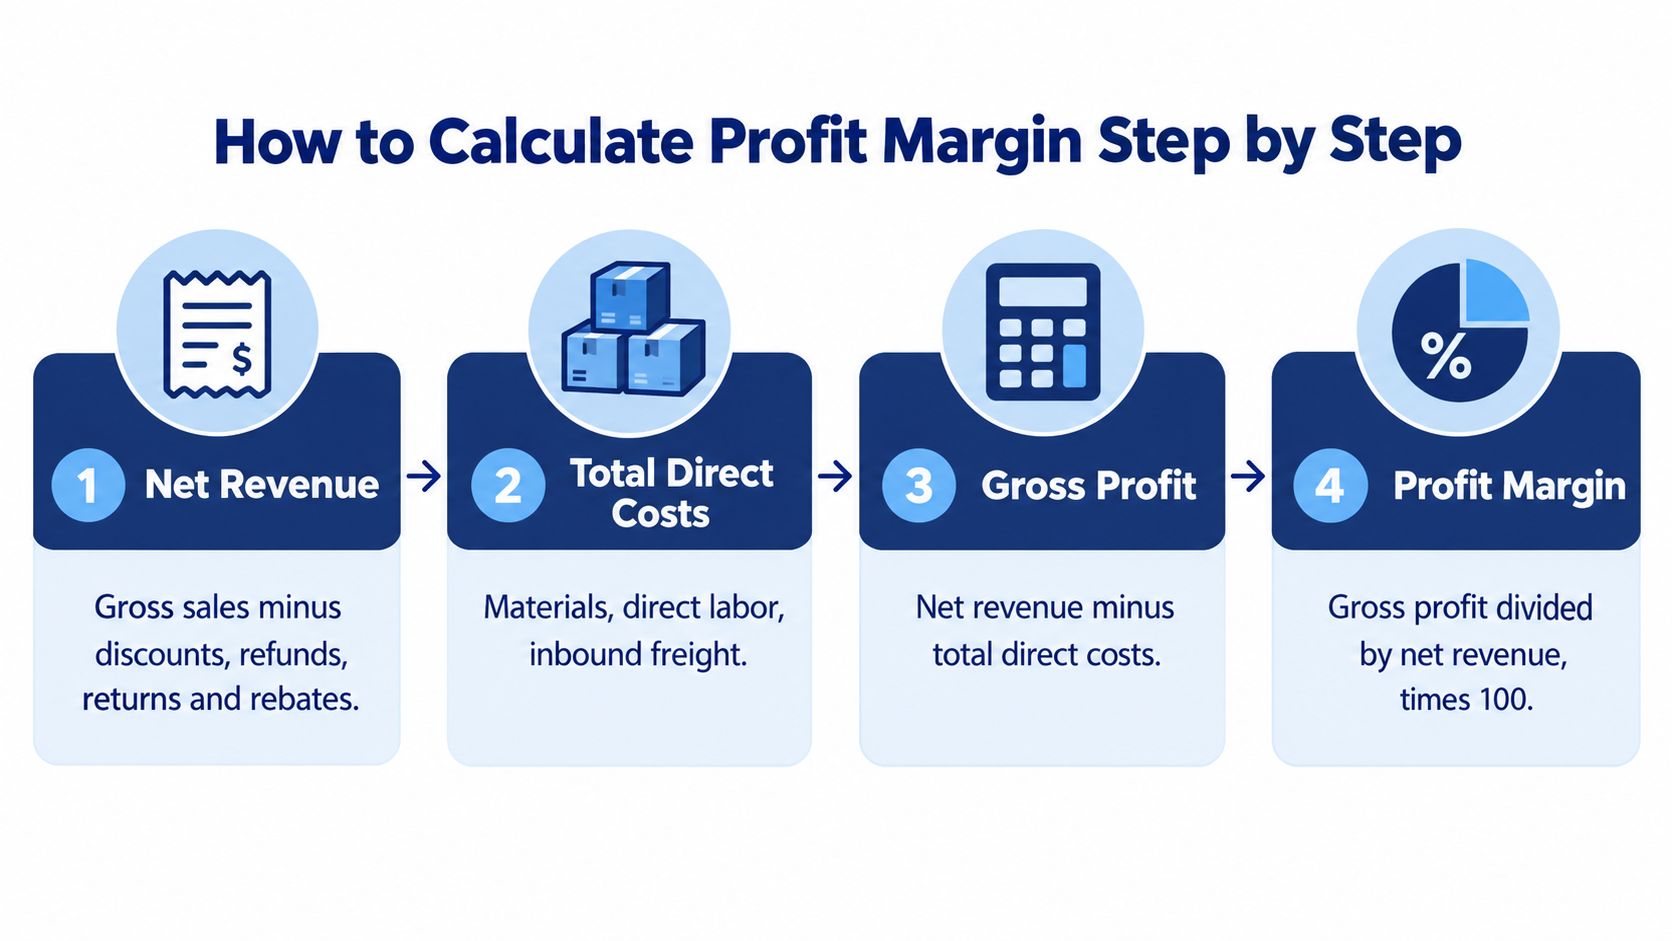
A clean P&L can still produce a bad margin if the lines are sorted carelessly. The arithmetic is the last step; the answer is decided earlier, when you choose which sales count as revenue and which costs belong to delivering them. The Ringy guide to profit margin frames the same discipline: define net revenue, classify costs consistently, and keep timing straight. Use this sequence to make the calculation repeatable, and keep markup out of it until pricing is reviewed separately.
Start with net revenue. Take gross sales and subtract discounts, refunds, returns, allowances, and rebates. If the denominator includes sales you didn't keep, the margin is flattered before you even get to costs.
Total direct costs. Identify costs tied to making or delivering the product, such as materials, direct labor, production overhead, and inbound freight. Subtract these from net revenue to get gross profit, then divide by net revenue for gross margin. If payment-processing charges belong in direct costs under your policy, apply that treatment consistently.
Subtract variable selling and delivery costs. Shipping, packaging, marketplace commissions, and other costs that rise with each sale can reveal the economics of a product or order more clearly than gross margin alone. Subtract them from net revenue to calculate contribution margin.
Subtract operating expenses. Rent, salaries, software, and marketing reduce operating income. Separate genuine one-time expenses from recurring costs when reviewing a trend, but keep them visible in the accounts rather than quietly sweeping them away.
Subtract interest, taxes, and other applicable items. The remaining profit is net income, which you divide by net revenue to calculate net margin.
Repeat the same method every month. Reconcile inventory and payment reports, and review margins by product, customer, channel, and month. Consistency makes a trend useful; changing cost rules month to month makes the chart decorative.
Classification trap: Moving $4,000 of packaging from COGS into overhead on $100,000 of net revenue lifts reported gross margin from 50% to 54%. No sale changed, and the business didn't become more profitable. The classification changed.
Timing can fool you, too. An annual subscription collected in one month may boost cash while the revenue is earned over several periods. An ecommerce business can have cash tied up in inventory, or see a weak monthly margin when seasonal purchases arrive before the related sales.
Watch for founder labor missing from operating expenses, owner draws treated as distributions rather than salary, and inventory write-offs skipped at month-end. Each can make the business look healthier than it is. If the work is a property or renovation project rather than a monthly operating business, use the same discipline when you evaluate deal profitability with PropLab: every purchase, holding cost, and selling fee still needs a line and a date.
A SaaS company can post a handsome gross margin and still find that the final number has lost most of its shine. Take a hypothetical monthly P&L with $100,000 in revenue, $18,000 in hosting and support costs, $70,000 in sales, research and development, and administrative expenses, plus $3,000 in interest and taxes. Gross profit is $82,000, so gross margin is 82%. Operating income is $12,000, giving a 12% operating margin, and net income is $9,000, giving a 9% net margin.
That 82% tells you the service is relatively inexpensive to deliver compared with revenue. It doesn't tell you whether the sales team and other overhead are earning their keep.
| Line item | SaaS | Service firm |
|---|---|---|
| Revenue after returns and discounts | $100,000 | $100,000 |
| Direct costs | $18,000 | $55,000 |
| Gross margin | 82% | 45% |
| Variable selling and fulfillment | Included in operating expenses | Included in operating expenses |
| Contribution margin | Not separately allocated | 45% |
| Operating expenses | $70,000 | $25,000 |
| Operating margin | 12% | 20% |
| Interest and taxes | $3,000 | $6,000 |
| Net margin | 9% | 14% |
Now take a hypothetical ecommerce brand. It starts with $100,000 in gross sales, then deducts $6,000 in returns and discounts to reach $94,000 in net revenue. Against that, it records $47,000 in product costs, $22,000 in fulfillment, shipping, payment, and marketplace fees, and $15,000 in marketing and payroll, plus $2,000 in interest and taxes. Gross margin is 50%, contribution margin is 26.6%, operating margin is 10.6%, and net margin is 8.5%. The key reveal is the cost between gross profit and contribution profit: half the gross margin is gone before marketing and payroll enter the picture.
A service firm's hypothetical $100,000 in revenue, $55,000 in billable staff costs, $25,000 in overhead, and $6,000 in taxes produces 45% gross, 20% operating, and 14% net margin. Whether billable labor belongs in direct costs or overhead changes what the gross margin says. The accounting label doesn't change the cash spent, but it changes which decision the percentage can support.
For firms that need to understand where repair labor and parts costs land, tracking repair jobs can help keep job-level records organized. Before comparing months, classify labor and other costs identically across each period. Otherwise, you're comparing bookkeeping choices, not performance.
An $80 product with a 25% markup sells for $100, but its margin is 20%, not 25%. Markup divides profit by cost; margin divides profit by the selling price. That denominator swap is a small piece of arithmetic with a habit of causing large pricing headaches.
| Markup on cost | Selling price | Margin on price |
|---|---|---|
| 10% | $88 | 9.1% |
| 25% | $100 | 20% |
| 50% | $120 | 33.3% |
| 100% | $160 | 50% |
The formulas keep the two measures straight:
To earn a 40% margin on an $80 cost, the price needs to be $133.33. That's a 66.7% markup, not the 40% many people assume. The Cleverence explanation of margin and markup makes the distinction especially relevant for businesses whose channel, fulfillment, or growth model affects which costs sit in gross profit.
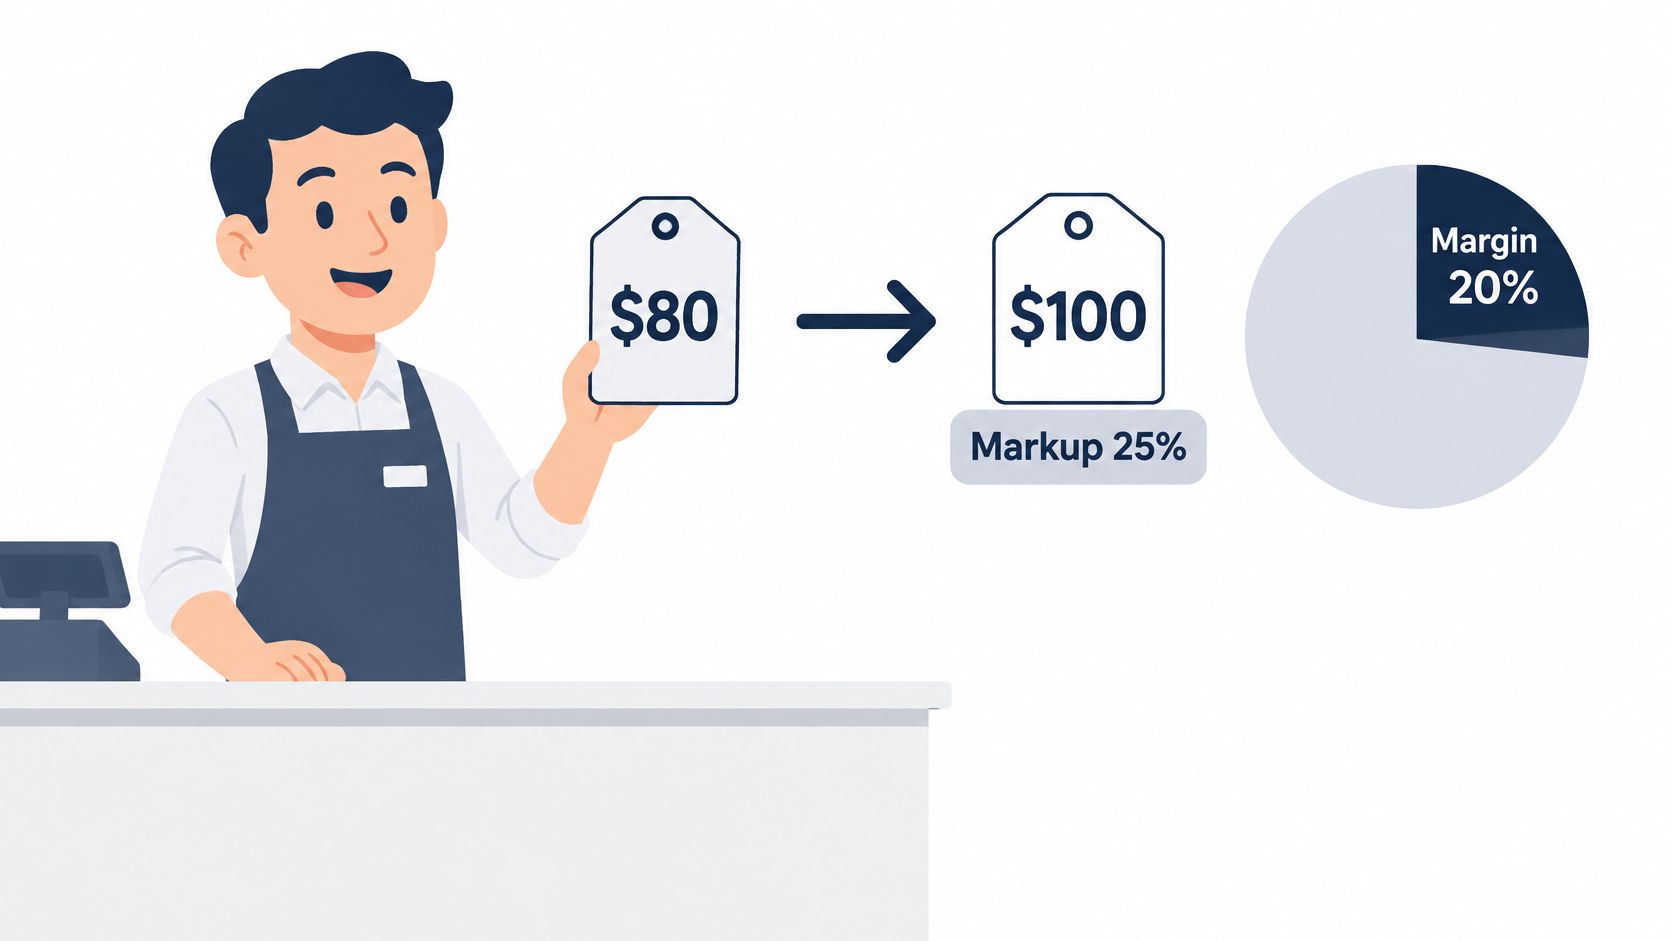
Pricing teams often work in markup while finance teams report margin. If the teams use the words interchangeably, the product can be underpriced without anyone spotting the mismatch. And list price isn't the whole story: refunds, discount codes, and marketplace fees can turn an apparently profitable product into a poor sale.
Run the actual sale through net revenue, direct costs, and variable selling costs. Markup helps set a price; contribution margin tells you whether the sale earns its keep. A product can show a healthy gross margin while the full sale becomes less profitable because important costs sit below gross profit or never make it into the calculation.
Set up one row per product or product line. Use A for product, B for revenue, C for COGS, D for variable selling and fulfillment costs, E for target margin, and F for monthly sales. Keep revenue as its own column so you can audit the denominator without reverse-engineering a formula.
| Task | Formula (row 2) | Notes |
|---|---|---|
| Gross margin % | =(B2-C2)/B2 |
Format the cell as Percentage |
| Contribution margin % | =(B2-C2-D2)/B2 |
D2 holds variable selling and fulfillment costs |
| Markup on cost | =(B2-C2)/C2 |
Use on pricing sheets, not in financial reports |
| Price for a target margin | =C2/(1-E2) |
E2 holds the target margin, such as 40% |
| Weighted margin across products | =SUM(profit range)/SUM(revenue range) |
Never average the product percentages |
| Blank-safe gross margin | =IFERROR((B2-C2)/B2,"") |
Returns a blank instead of a divide-by-zero error |
Format margin cells as percentages rather than multiplying by 100 inside the formula. Excel and Google Sheets use the same formula syntax, and the percentage format is available through the Format menu in Sheets. The displayed result then reads as a margin, not a decimal that someone has to mentally translate.
When you roll up product results, add the profit amounts and divide by total revenue. Don't take a simple average of product-level percentages: a low-volume product shouldn't get the same weight as a high-volume one.
A clean formula can't rescue messy inputs. Reconcile the sheet's revenue and cost totals against the general ledger each month, then investigate any mismatch before sharing the margin report.
Software can look wonderfully profitable at the gross level, then surrender much of that profit to payroll, sales, research, administration, interest, and taxes. The NYU Stern January 2026 U.S. sector dataset, which covers thousands of publicly traded companies, shows the contrast: software system-and-application companies averaged 71.72% gross margin and 25.49% net margin, while general retail averaged 33.18% gross margin and 5.6% net margin. A retailer survives on thin margins through inventory turnover and scale. None of that makes retail a useful benchmark for a software firm with a different cost structure.
The published figures don't fill a neat grid, so the honest way to lay them out is one row per reported number:
| Sector | Margin type | Value |
|---|---|---|
| All U.S.-listed companies | Gross margin | 37.76% |
| Software, system and application | Gross margin | 71.72% |
| Software, system and application | Net margin | 25.49% |
| General retail | Gross margin | 33.18% |
| General retail | Net margin | 5.6% |
| Advertising | After-tax operating margin | 9.69% |
| Aerospace and defense | After-tax operating margin | 7.76% |
| Air transport | After-tax operating margin | 4.49% |
Read that third group carefully. The NYU Stern operating margin table reports those figures after tax, while the operating margin formula earlier in this article, operating income divided by revenue, is a pre-tax measure. Compare your pre-tax operating margin against a pre-tax benchmark, or you're grading yourself against a different yardstick. Same margin type, same tax treatment, same revenue definition: that's the comparison rule.
Benchmarks are only as honest as your classification, too. If a published figure counts support staff in overhead and your books put them in COGS, your gross margin will look worse than the sector average even when the underlying economics are identical. Get the bookkeeping consistent before you read anything into the gap.

Percentages also hide scale. A business with $1 million in sales and $200,000 in net income runs a 20% net margin. One with $10 million in sales and $500,000 in net income runs 5%, yet earns more dollars. Both numbers are real, and neither alone tells you whether the business is healthy.
These benchmarks describe U.S.-listed firms, not private startups or small businesses. Other populations measure profitability differently: China's above-designated-size industrial enterprises recorded a 5.39% operating-revenue profit margin in 2024, down 0.30 percentage points from the previous year, according to the National Bureau of Statistics of China. In the UK, 77% of SME employers reported generating a profit or surplus in their most recent financial year, according to the Department for Business and Trade's Longitudinal Small Business Survey. Different populations, different measures.
I'd treat every published figure here as a sanity check, not a target. Your first benchmark should be your own monthly trend. If you're reviewing paid acquisition alongside profitability, ROAS benchmarks can add context, but they don't replace a margin calculation that includes the cost of fulfilling the sale. For a closer look at the operating measure, use this guide to what counts as a good operating margin.
If your margin reports look inconsistent, don't start by buying a fancier dashboard. Start by finding out who owns the definitions and reconciliations. These are the warning signs I'd take seriously:
Match the hire to the problem. A bookkeeper can handle reconciliations and clean COGS records. A CPA or tax accountant can sort out cash-versus-accrual treatment and tax-driven accounting questions. A financial analyst can build margin reporting by product and channel, so you can tell which lines are carrying their weight.
For broader P&L management, look for support that fits the actual workload rather than hiring on title alone. A focused part-time bookkeeper may solve a reconciliation gap; a team that needs forecasting and product-level reporting may need analytical support as well. Compare the quoted cost with the time and mistakes your current close consumes, not just the cheapest hourly rate.
This week, rebuild last quarter's margin waterfall for one product line: list price, discounts and refunds, net revenue, direct costs, variable selling costs, overhead, and net profit. If it won't balance in an afternoon, you've found a real process problem, not a formula problem. That's your signal to assign an owner or post the role.
If your margin numbers need a cleanup, HireAccountants connects US companies with pre-vetted accounting and finance professionals for bookkeeping, analysis, and P&L support. Find flexible part-time or full-time help to make your margin reporting consistent and decision-ready.
Let's simplify your finances today!