


You close the month, open the P&L, and there it is, a reassuring green number. Revenue looks healthy, expenses seem controlled, and you approve a founder draw. Three weeks later, payroll is due, two large invoices are still unpaid, and your bank balance looks like it has been mugged.
That's the small business profit and loss trap. Your P&L can show a profitable period while your operating cash is under pressure. It isn't useless. It's just answering a different question than the one your bank account is screaming.
A founder I know once finished a strong month with a healthy net profit, paid themselves a comfortable draw, and started planning a new hire. The revenue had been earned and recorded, but several customers were paying on delayed terms. When payroll arrived, the cash hadn't. The P&L looked calm. The bank account looked like a fire alarm.
That's not a bookkeeping error by itself. It's the difference between accrual profit and cash availability. Accrual accounting records revenue when it's earned and expenses when they're incurred. Cash flow tracks when money enters or leaves the account. Those dates often refuse to cooperate.
Practical rule: A green P&L means your business performed profitably over a defined period. It doesn't mean you can safely spend every dollar shown at the bottom.
This distinction matters because small businesses often operate with little room for timing mistakes. An invoice can improve reported revenue without paying a supplier, clearing payroll, or covering taxes. A loan can increase cash without becoming revenue. Owner draws can reduce cash without appearing as an operating expense. Treating these items as interchangeable is how founders end up financing growth with optimism and a credit card.
The OECD's analysis of small and medium-sized enterprises shows that profit margins fell sharply during the 2009 crisis, recovered gradually from 2012 onward, and stood above pre-crisis levels in most countries with available data by the late 2010s. The report defines the margin indicator for firms with fewer than 250 employees and notes that retained profits support self-funding and growth, which makes the P&L a useful signal of whether your company can build internal financial capacity (OECD SME and Entrepreneurship Outlook 2019).
Use the P&L as a decision tool, not a scoreboard. It should help you decide whether to change pricing, slow spending, collect receivables, delay a hire, or preserve cash. Founders and operators don't need to drown in GAAP jargon. They need to know what each line is saying, what it's hiding, and what action follows.
A profit and loss statement, or P&L, is a report that summarizes revenue and expenses over a specific period. Its basic job is simple:
Revenue minus costs and expenses equals net profit or loss.
The report usually follows a waterfall. Each stage answers a different operating question.
That order matters. A business can grow revenue while losing ground through weak pricing or bloated delivery costs. Gross profit exposes that problem earlier than net profit does. The Oregon SBDC describes the same core progression, revenue minus COGS equals gross profit, followed by operating expenses and other items before arriving at net profit or loss (how to read a P&L statement).
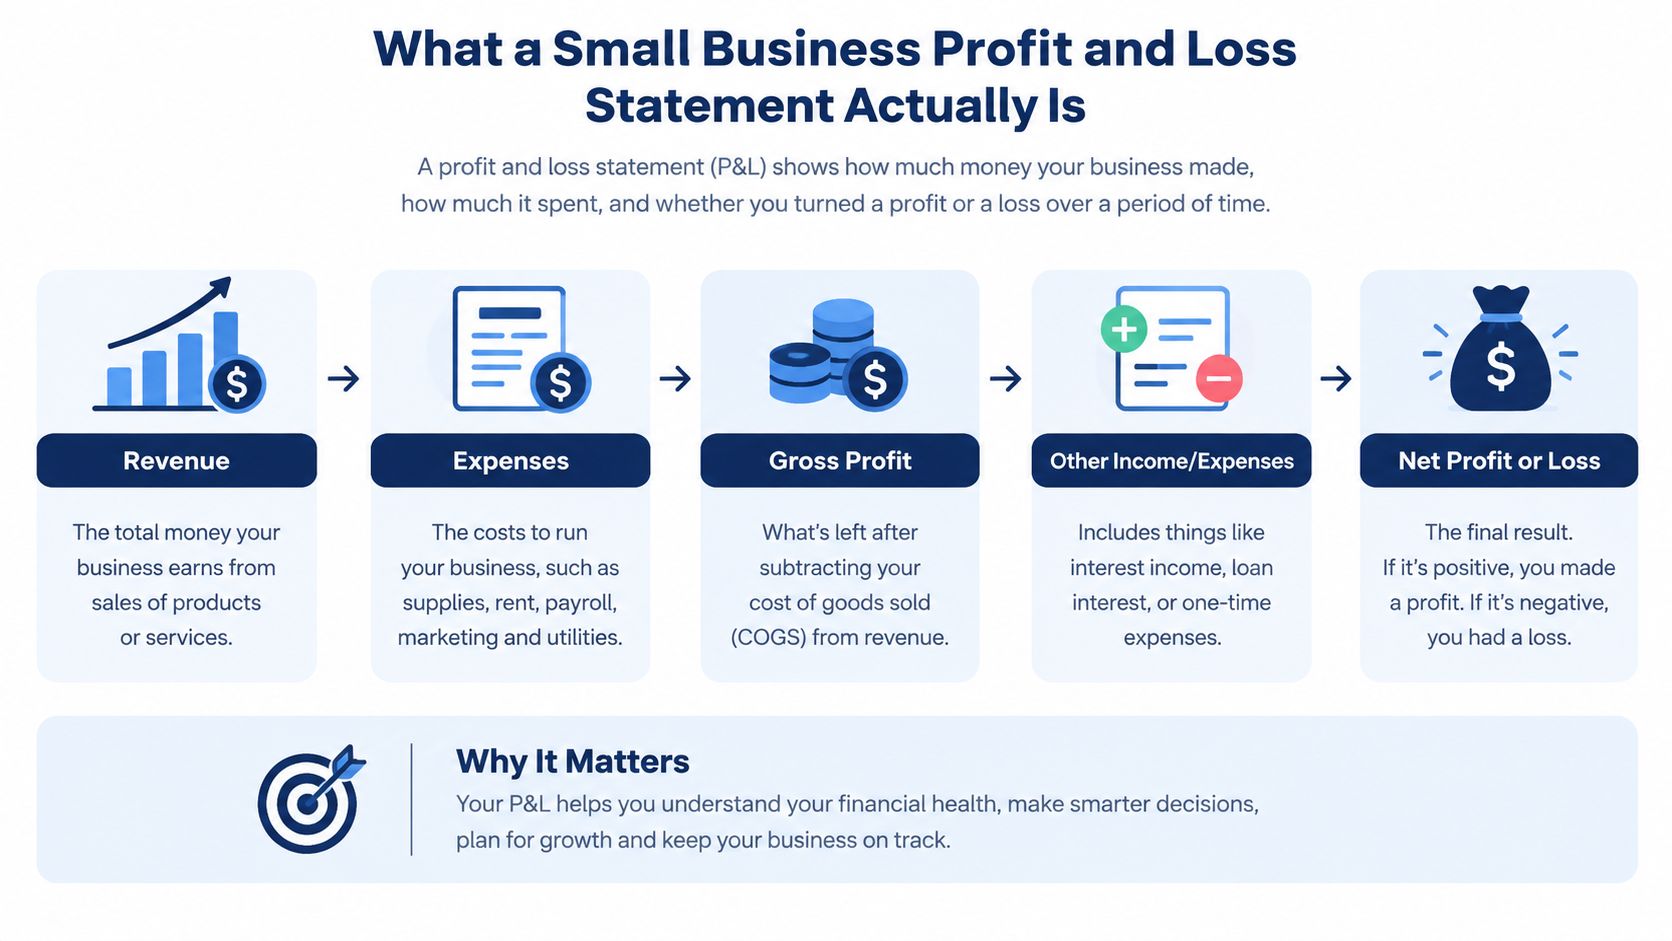
Under the accrual method, the P&L may record an invoice before the customer pays it. It may also record a bill before your team settles it. That makes the statement useful for measuring performance across a period, comparing margins, and spotting expense trends.
It doesn't make the P&L a substitute for the balance sheet or cash flow statement. The balance sheet shows assets, liabilities, and equity at a point in time. The cash flow statement shows actual cash movement. You need all three perspectives because a profitable operation can still struggle to meet immediate obligations when collections, inventory, debt payments, or payroll timing works against it.
FreshBooks notes that P&L reporting can run on the billed or accrual method and supports monthly, quarterly, and yearly views, which is why a consistent reporting cadence matters (FreshBooks P&L report guidance). Monthly reporting gives you a chance to find the leak before it becomes a financial basement flood.
Most founders glance at revenue, jump to net profit, and ignore the plumbing in between. That's like judging a restaurant by its bookings while refusing to inspect the kitchen.
Revenue is the top line, not the victory lap. Separate recurring revenue from one-time work, refunds from sales, and gross billings from the amount you expect to keep. A spike caused by a single project may look impressive while doing nothing for next month's capacity or cash planning.
Ask three questions:
Cost of goods sold includes direct materials, delivery labor, contractor costs tied to fulfillment, shipping, and other costs that move with delivery. Founders routinely undercount COGS by leaving delivery labor or allocated production overhead in operating expenses. That makes gross margin look healthier than the business really is.
Gross margin is not decorative math. It tells you how much room you have to pay for sales, administration, product development, taxes, and growth. If competitors can deliver a comparable offer with better contribution economics, your pricing or operating model needs work.
Sales and marketing should connect to a credible revenue engine. Research and development should connect to a product or capability you intend to sell. General and administrative costs should support the business without becoming a museum of subscriptions nobody uses.
Payroll deserves special suspicion. It's often the largest expense that founders can control slowly, which makes it dangerous. A hire can be strategically correct and financially premature at the same time.
The ignored lines matter too. Depreciation and amortization affect reported profit without requiring a current-period cash payment. Interest expense reveals the cost of financing. Owner distributions reduce cash and equity but shouldn't be disguised as operating expenses. Other income and expense can make a good month look repeatable when it was a one-off.
For a cleaner management pack, use these board-ready reporting tips to keep operating expense analysis tied to decisions rather than decorative reporting.
| Line Item | Calculation | Decision Trigger |
|---|---|---|
| Revenue | Sales and service income | Check repeatability, pricing, and collection |
| COGS | Direct delivery costs | Investigate falling gross margin |
| Gross profit | Revenue minus COGS | Revisit pricing or delivery model |
| Operating expenses | Costs to run the business | Cut waste before cutting capability |
| Operating income | Gross profit minus OpEx | Test whether the core model works |
| Interest expense | Financing cost | Review debt structure and cash burden |
| Owner distributions | Cash paid to owners | Confirm the business can fund them |
| Net profit | Final income after recorded costs | Use with cash flow, not instead of it |
A monthly close shouldn't require a candlelit weekend vigil and an apologetic message to your family. Give the process an owner, a deadline, and a chart of accounts that reflects how the business operates.
Start with the prior month's bank and card statements. Reconcile them by the fifth day of the following month, then classify each transaction against a fixed chart of accounts. Don't invent a new category every time a vendor uses a clever invoice description. Consistency makes trends visible.
Early-stage businesses can often have the founder or bookkeeper own the process. As the transaction volume and operating complexity rise, bring in more specialized review. Wave and Wave-compatible spreadsheets can suit a smaller operation, while QuickBooks Online or Xero offer stronger structure for a growing company. Dashboards such as LiveFlow or Fathom become useful when reporting needs to combine accounting data with management views.
Keep expense documentation organized with a system such as this guide to tracking business expenses. The tool matters less than the habit. A mediocre system used consistently beats an expensive platform filled with uncategorized transactions.

A 90-minute weekly bookkeeping block prevents month-end archaeology. Review uncategorized transactions, attach receipts, check payroll postings, and flag unusual costs before they pile up. The usual time sinks are misclassified COGS, payroll journals that don't reconcile, and owner draws buried in expense lines. Fix those weekly and your close becomes a review, not a rescue mission.
Net profit tells you whether recorded economics worked over a period. Cash flow tells you whether the business can keep paying people while those economics make their way through the banking system. You need both conversations at the same time.
To move from net income toward operating cash flow, adjust for non-cash items such as depreciation and amortization, then account for changes in receivables, payables, inventory, and prepaid expenses. A rise in accounts receivable can consume cash even when revenue and profit increase. A rise in accounts payable can temporarily preserve cash while creating future obligations.
| Line Item | P&L Treatment | Cash Impact | Example ($) |
|---|---|---|---|
| Net profit | Final reported earnings | Starting point for operating cash flow | 50,000 |
| Depreciation and amortization | Expense without current cash payment | Added back in the operating cash bridge | Not specified |
| Accounts receivable | Revenue may be recorded before collection | Increase consumes cash | 80,000 shipment billed on delayed terms |
| Accounts payable | Expense may be recorded before payment | Increase preserves cash temporarily | Not specified |
| Inventory | Cost is held before sale | Increase consumes cash | Not specified |
| Operating cash flow | Profit adjusted for timing and non-cash items | Shows cash generated by operations | 12,000 cash burn |
The worked scenario is deliberately uncomfortable. A business records a $50,000 profitable month, ships $80,000 of product on net-60 terms, and ends the period with a $12,000 cash burn. The accounting result and the cash result can both be accurate. The founder still has to pay the bills.
Profit can fund growth only after customers pay and the business survives the timing gap.
Break-even adds a forward-looking layer. The formula is:
Break-even quantity = fixed costs ÷ (sales price per unit minus variable cost per unit).
Fixed costs remain broadly stable as output changes, while variable costs move with sales or production. Rent, equipment, insurance, and salaries commonly sit on the fixed side. Materials, shipping, commissions, and direct labor commonly sit on the variable side (American Express break-even guide).
That contribution margin informs pricing, hiring, and capacity decisions. Before adding a person, calculate the revenue contribution required to cover the new fixed cost, then test the result against realistic collections rather than optimistic bookings. For a broader operating framework, review how to optimize route business cash flow, especially if timing and working capital are recurring headaches.
You can also pair this analysis with a practical guide on reading a cash flow statement. The bank balance isn't the enemy. Ignoring its relationship with the P&L is.
Net profit is important, but it's a lagging indicator. If you only check it, you're driving while watching the rearview mirror. By the time the bottom line turns ugly, the pricing problem, hiring mistake, or collection delay has usually been developing for months.
Track a small set of operating signals instead.
Gross margin percentage tells you how much revenue survives direct delivery costs. A service business below 50% or a product business below 25% should treat that position as a survival risk requiring intervention within the quarter. Those thresholds are management rules, not universal laws, but they're useful alarms.
Operating expense ratio shows how much revenue the company consumes outside COGS. Watch the trend, not just the current month. A single-month OpEx level above 110% of the trailing three-month average deserves an explanation before anyone approves new discretionary spending.
EBITDA margin helps isolate operating performance before interest, taxes, depreciation, and amortization. A quarter-over-quarter compression of more than two percentage points should trigger a review of pricing, headcount, delivery efficiency, and overhead.
Revenue per employee exposes whether the team is becoming more productive or more expensive. Don't use it as a blunt layoff formula. Use it to test whether your hiring plan has an economic engine behind it.
Cash conversion cycle shows how long cash remains tied up between paying for inputs and collecting from customers. A cycle stretching beyond 60 days demands attention to terms, billing speed, inventory, and collections.
The macro backdrop can make these indicators move quickly. World Bank business-demography data reports that about 20.4% of new businesses close within the first year, roughly half don't survive five years, and only about one-third reach the ten-year mark. The same source notes that micro enterprises account for 93.5% of enterprises in the European Union, and associates a one percentage point decline in real GDP growth with a 0.2 percentage point decline in average profit margin, while a one percentage point rise in interest rates is associated with a 0.35 percentage point reduction (World Bank Enterprise Statistics).
| KPI | What It Measures | Watch Threshold | Status |
|---|---|---|---|
| Gross margin | Economics after direct costs | Below 50% services, below 25% product | Investigate |
| OpEx ratio | Overhead burden | Above 110% of trailing average | Escalate |
| EBITDA margin | Core operating profitability | Compression above two points quarter-over-quarter | Review |
| Revenue per employee | Team productivity | Falling trend | Diagnose |
| Cash conversion cycle | Working-capital timing | Beyond 60 days | Act |
For a fuller operating dashboard, use this guide to key performance indicators in accounting. Ignore vanity revenue growth when margin and cash are deteriorating. Bigger can mean you're losing money at scale.
Templates work when they force honest classification. They fail when they turn payroll, contractors, interest, and owner activity into one cheerful “miscellaneous” bucket.
Here's a fictional monthly P&L for a six-person service business with $50,000 in revenue. The structure separates direct delivery costs from overhead, keeps owner distributions visible, and shows the gross-to-net waterfall vertically.
| Line Item | Amount | % of Revenue | Notes |
|---|---|---|---|
| Revenue | $50,000 | 100% | Client service revenue |
| COGS, contractors and delivery labor | $12,000 | 24% | Directly tied to client work |
| Gross profit | $38,000 | 76% | Revenue minus COGS |
| Payroll, non-delivery staff | $20,000 | 40% | Operating payroll |
| Software | $2,000 | 4% | Operating tools |
| Rent and occupancy | $3,000 | 6% | Fixed facility cost |
| Marketing | $3,500 | 7% | Demand generation |
| Insurance and professional fees | $1,500 | 3% | General administration |
| Operating expenses | $30,000 | 60% | Total listed OpEx |
| Operating income | $8,000 | 16% | Gross profit minus OpEx |
| Interest expense | $500 | 1% | Financing cost |
| Depreciation and amortization | $1,000 | 2% | Non-cash expense |
| Net profit | $6,500 | 13% | After listed expenses |
| Owner distributions | $4,000 | 8% | Cash distribution, not OpEx |
The numbers are less important than the architecture. If delivery labor belongs in COGS, keep it there. If an employee supports administration, keep that payroll in operating expenses. Mixing the two hides delivery economics and makes pricing decisions unreliable.
Owner distributions deserve their own visible line below net profit or in an accompanying cash view. They're a cash decision, not proof that the company spent money to produce revenue. Likewise, depreciation and interest shouldn't disappear into “miscellaneous.” If the business needs financing or equipment, the P&L should make those burdens obvious.
Avoid templates that present amounts in thousands without a clear label. Don't merge payroll and contractor costs when one is fixed and the other may vary with workload. Show the waterfall from revenue to gross profit to operating income to net profit. A grid that makes the reader hunt for the story is not reporting. It's a spreadsheet obstacle course.
A historical P&L tells you what happened. A forecast tells you what you're willing to do about it.
Build a rolling 90-day forecast from the last closed period. Start with actual revenue and expenses, then write the driver beside every forecast line. Revenue might follow signed work, qualified pipeline, renewals, or seasonal demand. Payroll should reflect current staff plus planned hires. Software should include known renewals. Rent, insurance, debt service, and other commitments need their own treatment because they won't politely vanish when sales soften.
| View | What to include | Driver |
|---|---|---|
| Last actual | Closed P&L with reconciled transactions | Booked results |
| This month forecast | Actual activity plus remaining expected revenue and costs | Current pipeline and commitments |
| Next quarter forecast | Revenue, COGS, OpEx, financing, and tax assumptions | Pipeline, seasonality, and hiring plan |
Don't forecast revenue as a wish. Separate committed work from probable work and keep an explicit assumption for timing. A signed contract may still collect slowly. A promising opportunity may never close. Your forecast should show the difference instead of blending both into one flattering number.
Then stress-test the model with a 20% revenue haircut. The source for this specific scenario is the Federal Reserve's 2026 Report on Employer Firms, which found that expectations for revenue and employment growth over the next twelve months fell to their lowest level since 2020. Chase's January 2026 small-business survey, meanwhile, reported positive year-over-year profit growth while 61% of small businesses reported unpredictable revenue or expense payments in the prior six months (Chase 2025 to 2026 small-business data). The practical lesson is blunt: current profit and future confidence can diverge.
Update the forecast every two weeks against actual results. Mark each variance as timing, volume, price, mix, or spending. If revenue misses, don't automatically slash marketing. If gross margin falls, don't celebrate top-line growth. If cash weakens while profit holds, accelerate collections and revisit payment terms before mortgaging the office ping-pong table.
A reliable P&L process gives you options. A stale one gives you surprises.
HireAccountants can connect US businesses with pre-vetted bookkeeping, accounting, financial analysis, and monthly close professionals who can build, clean up, and maintain a small business P&L. Visit HireAccountants to find finance support that fits your workload, whether you need ongoing bookkeeping or sharper forecasting before the next hiring decision.
Let's simplify your finances today!