


Most KPI advice gets this wrong from the first sentence. It tells you to track more, build bigger dashboards, and “stay data-driven,” which is how a finance team ends up babysitting a graveyard of charts that nobody uses to make a call. A KPI in business is not every number you can export from NetSuite, QuickBooks, or your CRM. It's the handful of quantifiable measures that tell leadership whether the company is moving toward a real objective, and whether someone should act now or keep watching.
That distinction matters more in finance and accounting than anywhere else. Your team doesn't need another screen full of vanity numbers dressed up like strategy. It needs a short list of measures that change a decision about collections, cash, margin, or headcount. If a number doesn't change what you do this month, it's not a KPI. It's wallpaper with better formatting.
Many guides, including the plain-language material from the KPI Institute's basics guide and the broader framing from KPI.com, begin by listing dozens of possible measures. That approach leaves a finance lead sorting through revenue, clicks, tickets, and activity counts before finding the few numbers that could change a decision. A metric can measure almost anything. A KPI earns its place by tracking progress toward a strategic goal.
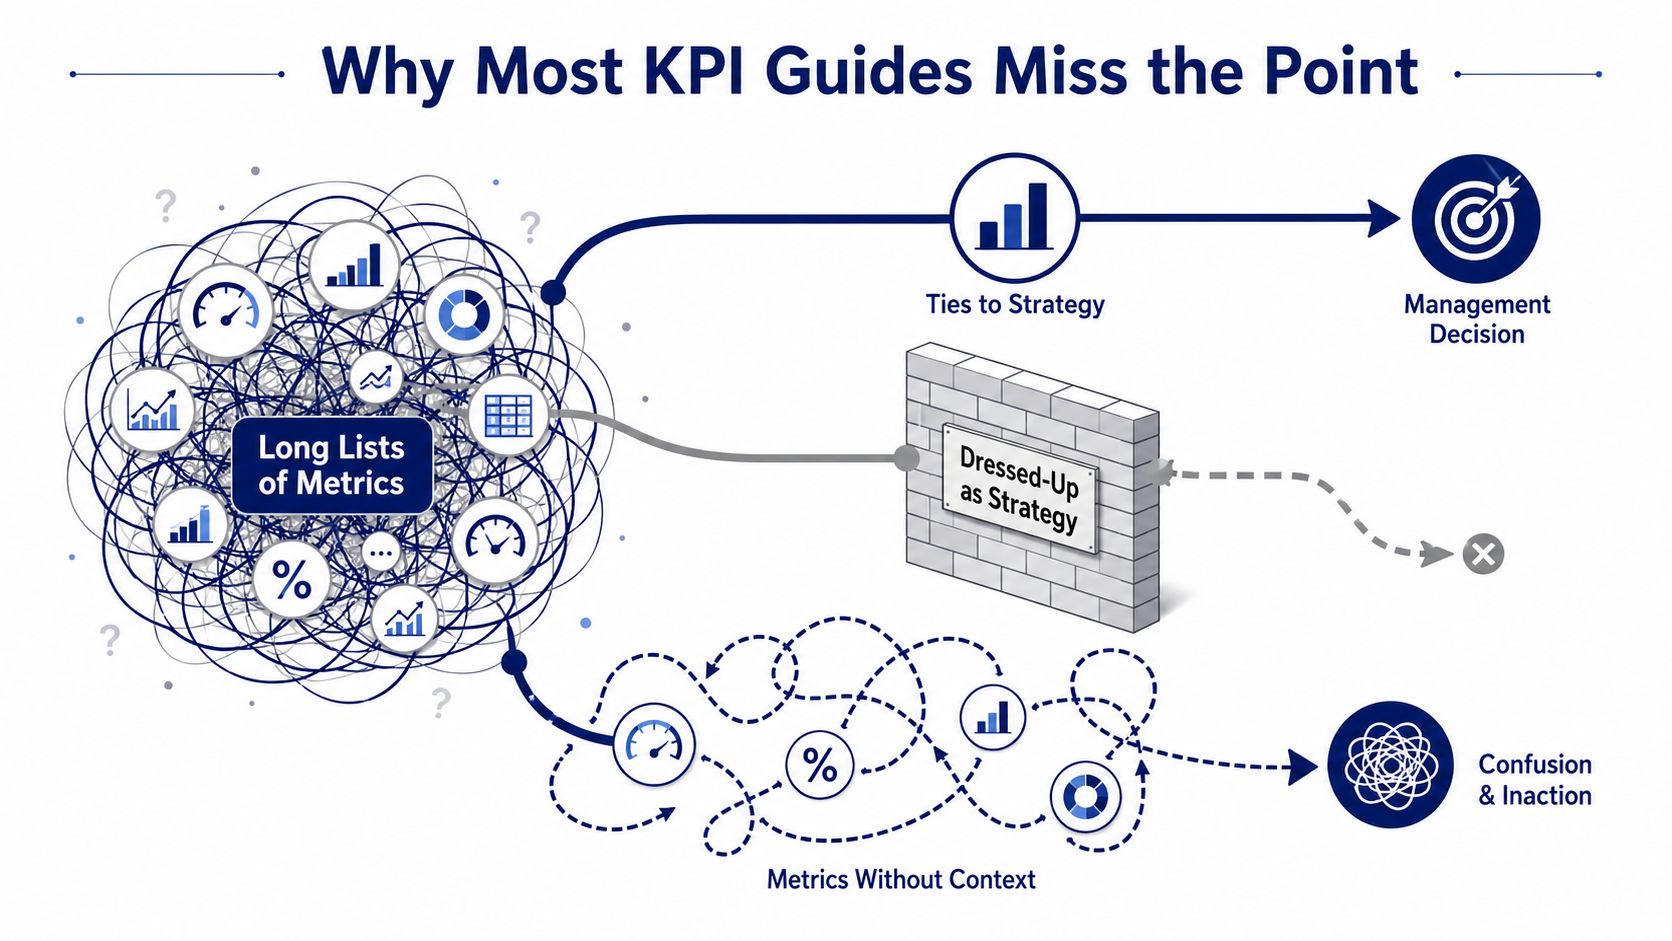
A crowded dashboard creates the appearance of control. In practice, it often buries the number that should trigger a forecast change, a collections escalation, or a hiring decision. A useful KPI must be specific, measurable, and tied to a target, consistent with the SMART-style guidance explained by SimpleKPI.
Finance teams should ask one hard question before adding any measure: “What decision changes if this number moves?” If the answer is unclear, leave the measure in the supporting report. The main KPI pack is not a warehouse for every export from the ledger, billing system, or CRM.
Practical rule: if a metric does not point to a decision, it does not belong on the main KPI pack.
A KPI is a quantified indicator chosen because it reflects progress on a core objective, not because software can graph it. Its value sits in the action attached to the result. A cash KPI might change payment priorities. A margin KPI might stop an unprofitable deal. A headcount KPI might delay a hire. Without that connection, the number is polished noise.
The history of KPI thinking reinforces this discipline. It developed from Peter Drucker's 1954 management-by-objectives work and gained a broader strategic structure when Robert Kaplan and David Norton introduced the Balanced Scorecard in 1992, covering financial, customer, internal process, and learning and growth views, as described in this KPI history overview.
Finance and accounting teams should rank measures by business consequence. Otherwise, impressive charts keep consuming attention while management decisions remain unchanged.
KPIs emerged to answer a management problem: is the business progressing, or are teams merely producing activity? Peter Drucker's 1954 management-by-objectives framework pushed leaders toward clear, measurable goals. As organizations expanded through the 1960s and 1970s, formal performance measurement spread across more functions, according to this KPI history summary.
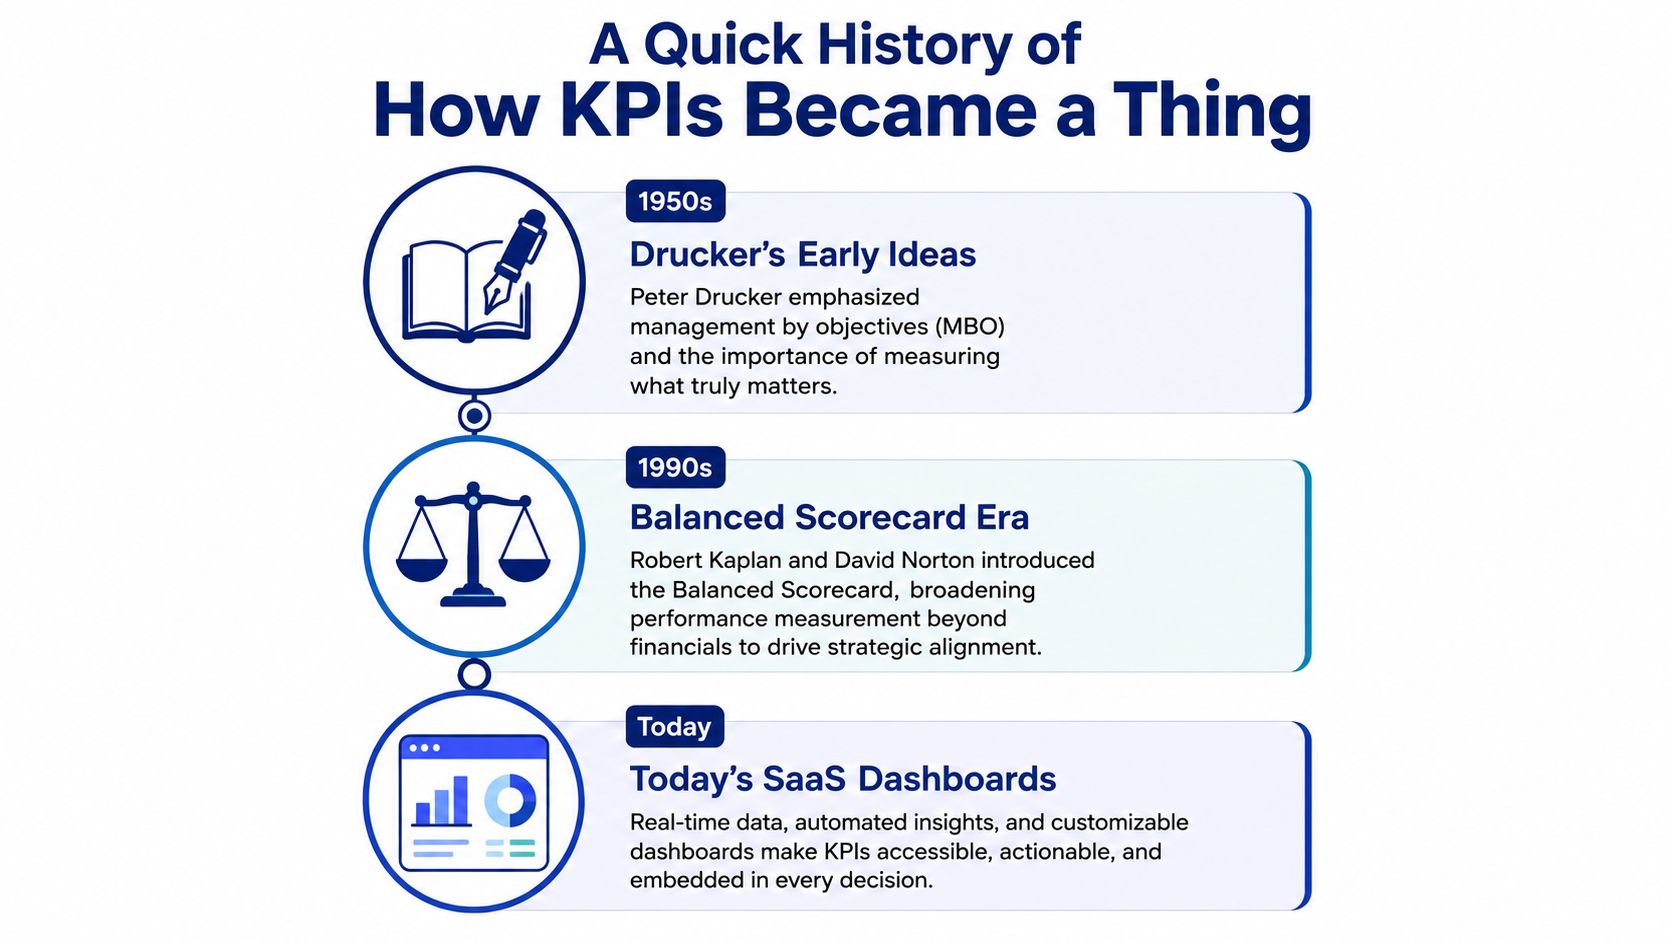
The major shift came in 1992, when Kaplan and Norton introduced the Balanced Scorecard. It organized performance around financial, customer, internal process, and learning and growth perspectives. The framework, also covered in this KPI history summary, reduced the risk of treating one output as proof of strategic progress.
That distinction matters in finance. Revenue can rise while cash collection slows, margins shrink, or delivery costs climb. A balanced set of KPIs forces managers to examine whether growth is profitable, operationally sound, and sustainable.
A KPI became more useful when leaders linked the number to cause, effect, and a management decision.
The working definition remains straightforward. A KPI is a critical, quantifiable measure of progress toward a desired result. It earns attention because it filters out activity that does not affect the result. Operational guidance in Corporater's KPI history note similarly emphasizes measures that are specific, measurable, and tied to a target.
Finance and accounting teams need that discipline more than dashboard collectors do. Data now arrives continuously from ledgers, billing systems, payroll tools, and customer platforms. Monitoring can happen before month-end, giving managers time to adjust collections, spending, hiring, or pricing before the close exposes the problem.
The test is simple: if a KPI moves, identify the decision it changes. If no decision follows, keep the number in supporting analysis, not the main management pack. Dashboards should expose pressure points, not preserve every available export.
Teams waste time. They label every number a KPI, then wonder why the dashboard feels heavy and useless. A metric is any measurable business activity. A KPI is the metric tied to a strategic objective and to a management decision. That's the part people skip because it's inconvenient.
Think of it this way. Total signups is a metric. It tells you volume. Trial-to-paid conversion is much closer to a KPI if the leadership question is whether the funnel is producing revenue, because it changes how sales, product, or finance allocates effort. One number fills a slide. The other can change a forecast.
| Dimension | Generic Metric | True KPI |
|---|---|---|
| Strategic tie | Loose or unclear | Directly linked to a business objective |
| Decision impact | Usually informational | Triggers a management action |
| Scope | Broad, often descriptive | Narrow, focused on a critical outcome |
| Dashboard role | Background monitoring | Main operating signal |
| Example in finance | Total invoices issued | Days sales outstanding |
| Risk if overused | Noise and clutter | None, if kept few and sharp |
A lean finance team should care about this distinction because it cuts dashboard sprawl fast. If a number doesn't change a decision, it stays in background monitoring. If it does, it earns KPI status. That's the whole sorting mechanism, and it saves you from building what amounts to a decorative spreadsheet museum.
Finance lives in the land of cascading consequences. A bad number in collections hits cash, cash hits hiring, and hiring hits growth. So the KPI filter has to be stricter than the usual “track what's available” logic. Strong KPI design separates leading indicators from lagging indicators, because one helps you steer and the other tells you where you already landed, a distinction reinforced in Investopedia's KPI explanation.
For finance, that means you stop celebrating every visible metric and start asking one ugly little question. Does this number tell us something we can act on, or is it just nice to know? Nice to know is not a business model.
SMART sounds academic until you translate it into finance. Then it becomes practical very quickly. Specific means the KPI ties to a real line in the P&L or cash flow statement. Measurable means the source is defined. Achievable means your staffing and systems can produce the number. Relevant means the finance team can influence the outcome. Time-bound means there's a review cadence, not endless hand-waving.
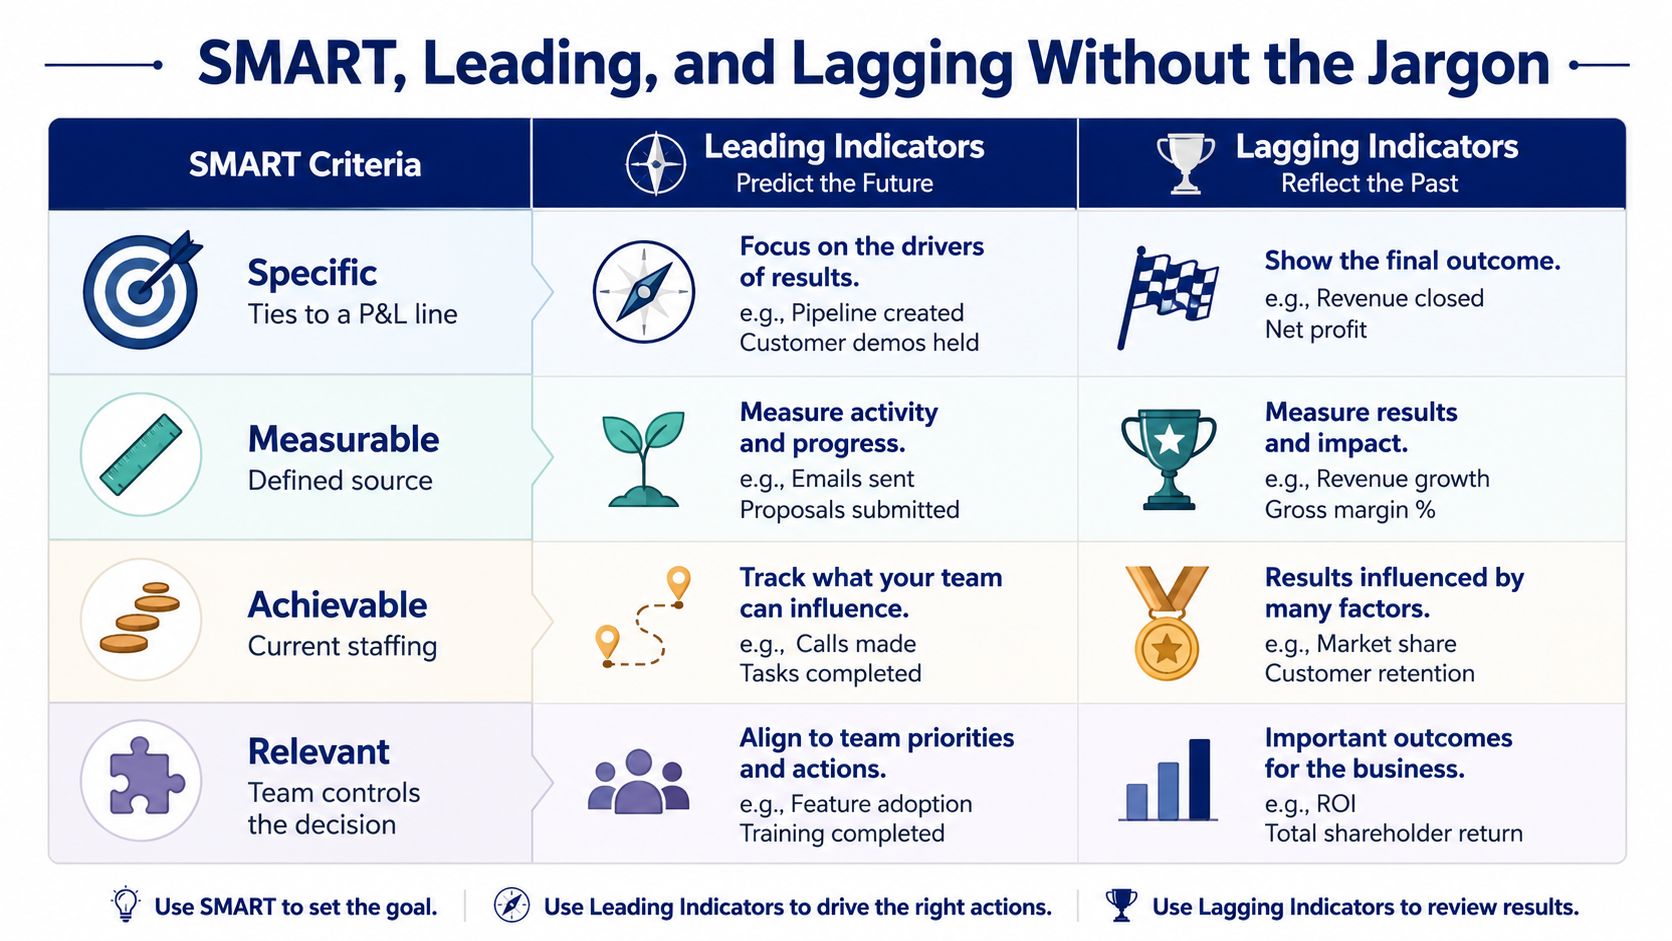
A lagging indicator tells you what already happened. Accounts receivable days is a classic example. It confirms how well collections worked after the fact. A leading indicator predicts what will happen and gives you time to intervene, like weekly collections outreach volume, which tells you whether the team is doing the work that should improve future receivables.
That split matters because lag-only dashboards are rearview mirrors. They're clean, but they're late. Leading KPIs are messier, because they depend on behavior and timing, but they let you steer before the quarter is gone. The best performance measurement guidance keeps stressing this pairing, including human performance's note on input and outcome measures and the KPI Institute's reminder about combining leading and lagging indicators.
Practical rule: use one leading KPI for each lagging outcome you actually care about.
Leading indicators are noisier. You need tighter definitions, or the whole thing turns into guesswork. Lagging indicators are cleaner, but they arrive too late to rescue the quarter. That's the trade. Anyone promising a dashboard that is both instant and perfect is probably selling you a slide deck.
For a small finance team, the fix is simple. Keep the KPI tied to one decision, set a review cadence, and don't let a good-looking lagging number trick you into skipping the steering input that made it happen.
Finance KPI lists get bloated fast, so let's cut through the junk. The numbers that matter most are the ones that tell leadership whether the business is profitable, liquid, and collecting money. Everything else is secondary unless your model says otherwise.
| KPI | What It Tells You | Common Misread |
|---|---|---|
| Revenue growth | Whether the top line is expanding | That growth alone means the business is healthy |
| Gross margin | Whether scaling is actually paying off | That revenue volume fixes weak unit economics |
| Operating cash flow | Whether the core business is generating cash | That accounting profit equals cash in the bank |
| Free cash flow | The clearest survival scorecard | That the company can spend freely because revenue looks good |
| Days sales outstanding | How disciplined collections are | That invoicing well means cash arrives quickly |
| Days payable outstanding | How much cash drag supplier payments create | That delaying suppliers is always harmless |
| Inventory turnover | Whether working capital is leaking in product businesses | That stocked shelves are the same as healthy operations |
| Runway | How long cash can support the business | That a strong backlog protects you from bad cash timing |
| Net burn | How fast cash is being consumed | That gross revenue can offset weak cash management |
| Cash conversion cycle | How efficiently cash moves through the business | That profit and cash move on the same clock |
| EBITDA | Useful for comparison across businesses | That it's a cash proxy |
Revenue growth is the headline, but it can hide ugly mix shifts. Gross margin tells you whether scale is real or just busy. Operating cash flow shows whether the business is producing cash from its core work, while free cash flow is the cleaner survival scorecard because it strips out the wishful thinking and asks what's left after the essentials.
Days sales outstanding is the collections discipline test. Days payable outstanding shows how much cash cushion you're getting, and inventory turnover catches working capital leaks in product businesses. If you're building a stronger finance dashboard, it helps to cross-check these with the formulas and definitions in this financial ratios resource.
For teams thinking about broader control frameworks, critical data governance metrics are also worth a look, because bad source data makes even good KPIs useless. The point isn't to admire the dashboard. It's to trust the number enough to make a call, which is exactly where this governance guide becomes relevant.
EBITDA still has a place, especially for comparison. Just don't pretend it's cash. Revenue can rise while the company slowly bleeds out. Finance teams that miss that usually discover it the hard way, which is a painfully expensive way to learn a basic lesson.
A lean finance team should not manage twenty KPIs. That's not discipline. That's spreadsheet sprawl with a payroll attached. The right setup is usually five to seven numbers max, each tied to a specific management decision, and each owned by a real person who knows where the data comes from and when it refreshes.
Don't start with a template. Start with the monthly questions the founder or CFO asks when the room gets quiet. Can we hire? Do we need to tighten collections? Are margins holding? Is cash safe? Those questions tell you which KPI deserves a seat on the page.
Then map each candidate number to four things. Owner, source system, refresh cadence, and decision it triggers. If you can't name all four, the number probably doesn't belong in the operating pack. That's also where tools and support services come in. A team using HireAccountants' financial analytics services can tighten reporting, but the principle stays the same. If nobody owns the number, nobody acts on it.
Keep the pack short enough that one person can explain every line without improvising.
The cadence matters. Send the KPI pack 48 hours before the meeting. During the meeting, talk only about deltas and exceptions. Then capture action items against the leading indicators that explain the lagging numbers. That keeps the conversation focused on causes, not just symptoms.
If the dashboard keeps growing, stop and cut. More charts do not equal more insight. They usually mean more excuses. The clean operating rule is simple, one page, one meeting. If a KPI cannot fit into that rhythm, it's not operational enough yet.
Founders love dashboards until the dashboard asks for accountability. Then the spreadsheets get “revisited next week,” which is founder code for buried forever. The same three mistakes keep showing up.
A vanity metric feels good because it moves. Total LinkedIn followers can rise. Raw revenue can rise. None of that matters if margin is collapsing or cash is drying up. A number is only useful if it changes a decision you'd make this month. Otherwise, it's applause, not management.
A lot of founders review last quarter's results as if the quarter is still alive. It isn't. If the only KPI in the pack is lagging, the team is already late. You can't steer a business with a report that acts like a rearview mirror and then asks why you hit the guardrail.
Thirty numbers look impressive. They also guarantee nobody reads all thirty. A cluttered pack turns every meeting into a scavenger hunt, and the signal gets lost under the pile. That's why the hard test works so well.
If a KPI moved 20% next week, would you do something different? If the answer is no, kill it. No debate, no sentimental attachment, no “we might need it someday.” Someday is where dead dashboards go to breed.
Week one is an audit. List every number on the current dashboard and score each one against the one-question test. If it wouldn't change a decision, cut it or bury it in background reporting. That's how you clear the junk without turning the process into a religion.
Week two is selection. Pick five or fewer decision-linked KPIs across revenue, margin, cash, and operations. If a number doesn't have a clear owner, leave it off. If it doesn't have a source, leave it off. If it doesn't have a target, leave it off. That's not being picky. That's being honest.
Week three is instrumentation. Define the source, owner, refresh cadence, and target for each KPI. Then wire the review into your operating rhythm using financial planning and analysis support if the team needs help building the structure. The system should be boring. Boring means repeatable, and repeatable means useful.
Week four is cadence. Book a 30-minute monthly KPI review and attach a one-page written summary. If the team can't explain the numbers in one page, the numbers aren't ready.
Monday-morning checklist, screenshot this and use it: audit, cut, pick five, assign owners, set targets, book the recurring meeting, revisit in 90 days. If you want cleaner reporting, sharper decisions, and fewer dashboard fossils, start with HireAccountants and build a KPI pack that your finance team can use, not just admire.
Let's simplify your finances today!