


A P&L is a period-based report showing Revenue − Expenses = Net Income or Loss. It's one of the three core financial statements every business runs, alongside the balance sheet and cash flow statement.
At 11 p.m., the spreadsheet says you made money last month. Your bank account says otherwise. Payroll is approaching, a customer still hasn't paid, and you're wondering whether the business is profitable or merely excellent at producing attractive accounting fiction.
That's why understanding what is P&L in business matters. The basic formula is easy. Reading the result well enough to make a hiring, pricing, or runway decision is where founders earn their coffee.
A profit and loss statement, also called an income statement, shows a business's revenue, expenses, and resulting net income or net loss over a defined accounting period. The period might be a month, quarter, or year. The U.S. Securities and Exchange Commission describes the income statement as one of the primary financial statements and identifies revenue, expenses, and net income or loss as its core components in its income statement accounting guide.
The clean version is:
Revenue − Expenses = Net Income or Loss
Revenue exceeds expenses, and you report net income. Expenses exceed revenue, and you report a net loss. Simple enough to fit on a sticky note, although plenty of businesses manage to bury the answer under forty-seven expense categories and a chart of accounts designed by someone who enjoys suffering.
A P&L answers one narrow question: did the business earn more than it spent during this period? It doesn't tell you how much cash sits in the bank, what the business owns, or what it owes at a particular moment. Those answers belong to the balance sheet and cash flow statement, the other two core financial statements.
Founders care about the P&L because it turns activity into an operating verdict. Are customers paying enough to cover delivery costs? Are salaries growing faster than gross profit? Can the company support another hire without mortgaging the office ping-pong table?
Banks, investors, and tax authorities also expect financial reporting that explains business performance. The P&L gives management a common language for pricing, hiring, spending, and expansion. Sage's explanation of profit and loss statements notes that businesses use the report to compare performance across periods and identify trends in gross profit, operating income, and net income.
Founder rule: Revenue proves that someone bought something. Net income shows whether the business kept anything after paying for it.
The catch is timing. Most useful P&Ls use accrual accounting, so the report recognizes revenue when it's earned and expenses when they're incurred, not necessarily when money changes hands. That makes the P&L better for measuring operating performance than a bank balance alone, but it also creates the cash surprises we'll get to shortly.
Read a P&L from top to bottom. Every line answers a different operating question. Jumping straight to net income is how founders miss the leak sitting higher up, often in pricing, delivery costs, or overhead.
Revenue starts the statement. Gross revenue captures sales before returns, discounts, and allowances. Net revenue shows what the business expects to keep after those deductions. A company can post impressive gross sales while refunds, credits, or promotional pricing weaken the economics. Before changing your chart of accounts, review understanding income and revenue to separate the common terms correctly.
Next comes cost of goods sold, or COGS. These are direct costs required to deliver the product or service, including materials, inventory, direct labor, and delivery-specific tools. COGS does not include general overhead such as rent, broad administrative salaries, or most company-wide marketing. If a cost would still exist without making or delivering the sale, it probably belongs outside COGS.
Subtract COGS from revenue to get gross profit. Divide gross profit by revenue to calculate gross margin, the share left to fund operating expenses and profit. Here, pricing power and delivery efficiency become visible. A falling gross margin deserves attention before anyone starts trimming office snacks, because small overhead cuts cannot repair weak unit economics.
Operating expenses cover the cost of running the company beyond direct delivery. Selling expenses include commissions and marketing. General and administrative expenses include rent, finance, legal, insurance, and administrative payroll. Research and development may appear separately when product development is material to the business.
Subtract operating expenses from gross profit and you reach operating income. It measures the core business before financing and tax effects. Use it when deciding whether the operating model works, whether another hire fits the model, or whether spending is outrunning the gross profit base.
Non-operating items follow, including interest income, interest expense, and other gains or losses. These lines can change the final result without changing the strength of day-to-day operations. Loan interest belongs here. Principal repayment affects cash and the balance sheet, not operating profit.
The statement then shows pre-tax income, income tax expense, and net income or net loss. Net income is total revenue less total expenses. A net loss appears when expenses exceed revenue. The SEC's accounting guide describes this structure, including taxes and other expenses.
| Line Item | What It Measures | Includes / Excludes |
|---|---|---|
| Revenue | Sales earned during the period | Includes sales activity, excludes deductions when presented as net revenue |
| COGS | Direct cost of delivery | Includes direct labor and materials, excludes general overhead |
| Gross Profit | Revenue left after direct costs | Includes the economic spread before operating expenses |
| Operating Expenses | Cost of running the company | Includes selling, general, administrative, and relevant R&D costs |
| Operating Income | Core operating result | Excludes financing and tax effects |
| Non-Operating Items | Financing and incidental gains or losses | Includes interest and other non-core items |
| Net Income or Loss | Final period result | Includes operating costs, interest, taxes, gains, and losses |
Treat none of these lines as automatically spendable cash. Accrual accounting can record a sale before the customer pays, or an expense before the company settles it. The P&L can therefore show healthy profit while the bank balance looks strained. Read the profit number alongside collections, payment obligations, and cash flow before approving a hire, changing prices, or making a runway decision.
The P&L uses accrual accounting. It records revenue when earned and expenses when incurred, regardless of when cash moves. NetSuite's P&L overview explains why this approach gives a clearer view of operating performance than cash timing alone.
Take a December invoice. You deliver the work and issue the invoice in December, but the customer pays in January. December revenue and profit can increase even though December cash remains unchanged. Your balance sheet records the unpaid amount as accounts receivable. When the customer pays, cash rises and accounts receivable falls.
The same logic runs in reverse for expenses. An expense incurred in December but paid in January can reduce December profit before December cash leaves the account. The balance sheet carries the unpaid obligation as accounts payable. Accounting isn't lying here. It's answering a different question.
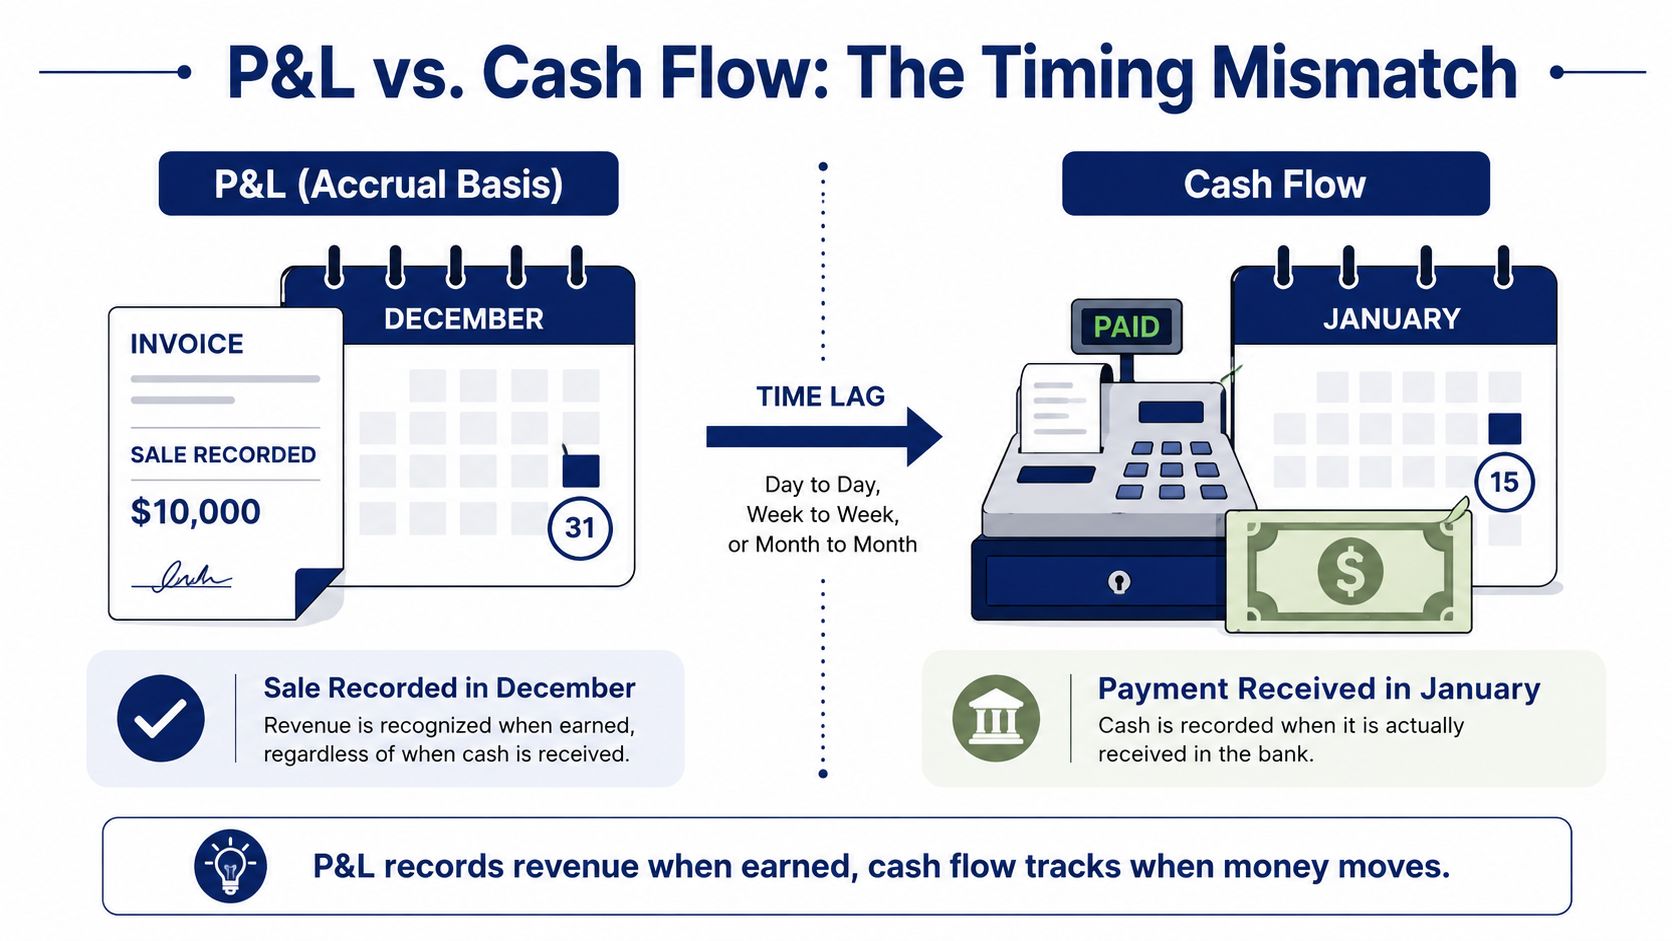
The cash flow statement tracks actual money moving through operating, investing, and financing activities. It shows whether profitable operations are producing liquidity, whether equipment purchases are consuming cash, and whether borrowing or owner funding is filling the gap.
The balance sheet shows assets, liabilities, and equity at a point in time. It explains where the accrual items sit while the cash flow statement explains how cash changed. A profitable P&L can sit beside a frightening bank balance when customers pay slowly, inventory requires upfront funding, or the company carries substantial prepaid costs.
That's why founders should pair monthly P&L reviews with practical cash flow strategies for 2025, while also learning how to read a cash flow statement. Profit tells you whether the period worked economically. Cash tells you whether the business can survive the next payment run.
A profitable P&L with no liquidity is a business achievement trapped in a waiting room.
Reading only the P&L is like checking the speedometer while ignoring the fuel gauge. You need the operating result, the obligations, and the money available to keep moving.
Revenue and net income are headline numbers. They're also easy to misuse. The three margins that deserve your attention are gross margin, operating margin, and net margin, because each strips away a different layer of the business.
Use one fictional SaaS-like business. It reports $500,000 in revenue, $300,000 in COGS, and $120,000 in operating expenses. It also has $20,000 in interest expense, $10,000 in interest income, and $15,000 in tax expense.
Gross profit is $500,000 minus $300,000, or $200,000. Gross margin is $200,000 divided by $500,000, or 40%. That tells you how much remains after delivering the product. If the margin is weak, inspect pricing, infrastructure, service consumption, and other direct delivery costs before hiring another salesperson.
Operating income is $200,000 minus $120,000, or $80,000. Operating margin is $80,000 divided by $500,000, or 16%. This measures whether the core business works before financing and tax decisions enter the picture.
Pre-tax income is $80,000, plus $10,000 of interest income, minus $20,000 of interest expense, or $70,000. After the $15,000 tax expense, net income is $55,000. Net margin is $55,000 divided by $500,000, or 11%.
The formulas and margin definitions align with profit margin guidance from the Corporate Finance Institute. Track all three over time and compare them with your budget or relevant industry benchmarks. A single margin doesn't tell you whether performance is improving, deteriorating, or seasonal.
| Margin | Formula | Example Value | What It Tells You |
|---|---|---|---|
| Gross Margin | Gross Profit ÷ Revenue | 40% | Delivery economics, pricing power, and direct cost control |
| Operating Margin | Operating Income ÷ Revenue | 16% | Efficiency of the core operating model |
| Net Margin | Net Income ÷ Revenue | 11% | Final profitability after financing, taxes, and other items |
Gross margin is the product question. Operating margin is the management question. Net margin is the final scoreboard, but it can be affected by financing choices that have little to do with product quality.
For a deeper operating-margin lens, use this guide to what makes a good operating margin. Don't chase a magic percentage. Watch direction, investigate variance, and compare like with like.
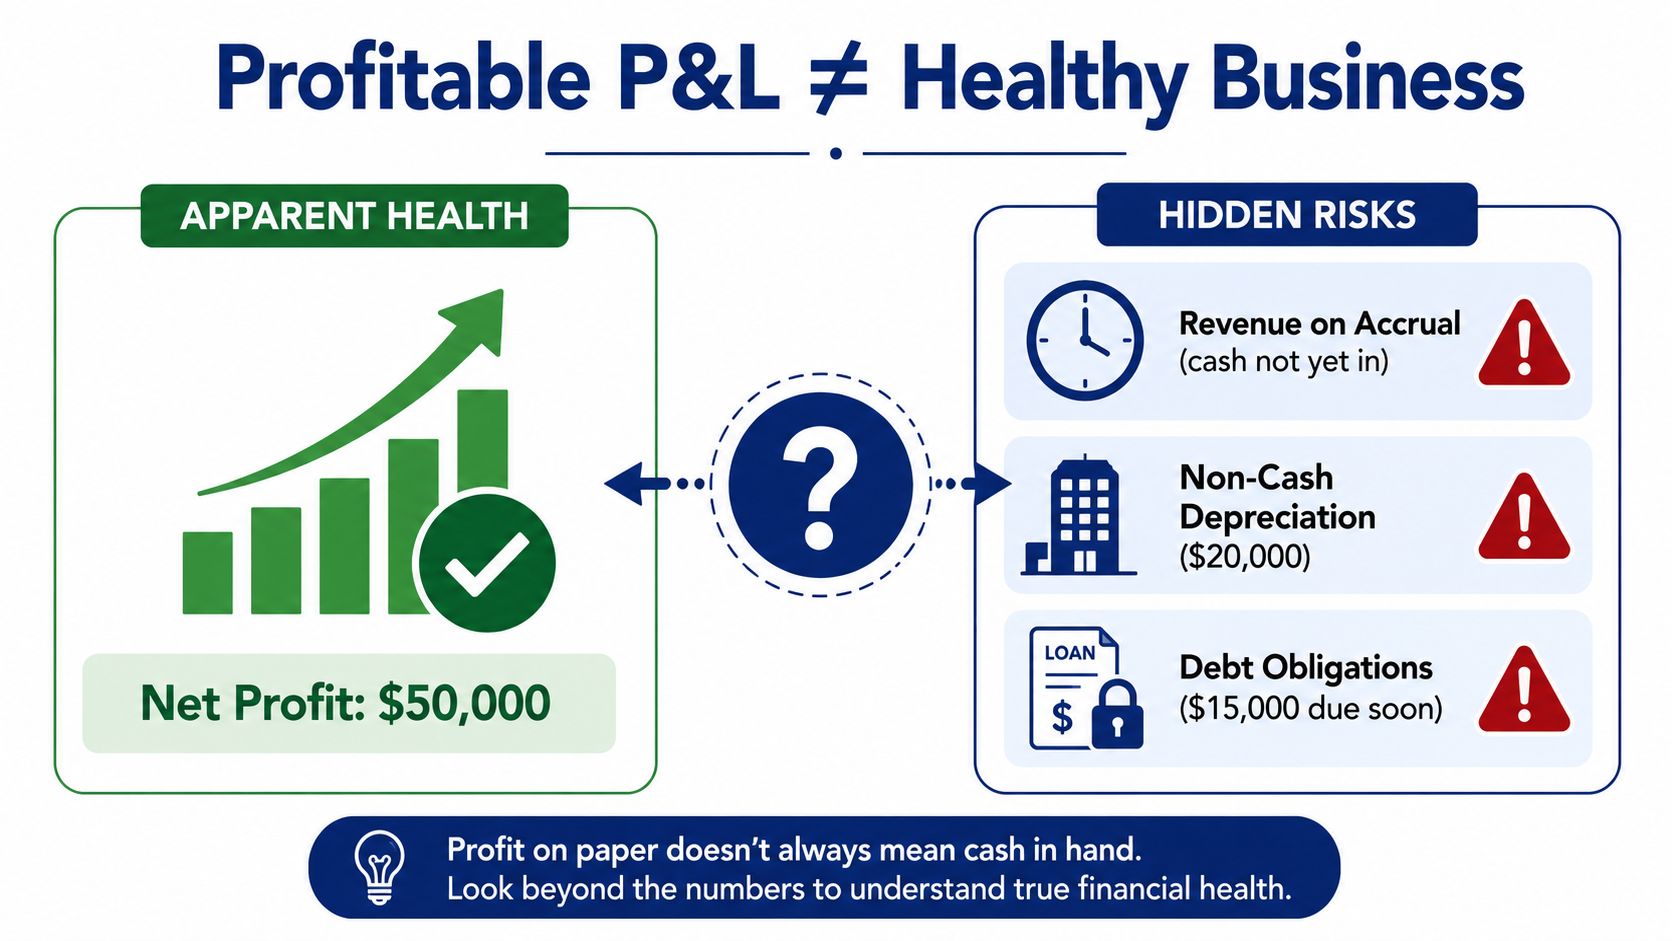
A profitable P&L doesn't guarantee a healthy business. It proves that the accounting rules produced a profit for the selected period. Those are not the same statement, and confusing them is how founders approve commitments their cash balance can't support.
Revenue can be recognized before cash arrives. That's ordinary accrual accounting, not fraud, but it can still create a hiring trap. You see strong sales, approve three new salaries, and discover that the biggest customer won't pay for another stretch of time. The P&L looked ready. The bank account didn't.
Depreciation and amortization create another blind spot. They reduce reported profit without requiring a current-period cash payment. That makes net income lower than cash generated in some periods, but it doesn't mean the cash is freely available. The business may still need to replace equipment or fund future product investment.
Owner bonuses disguised as consulting fees can inflate operating expenses or obscure compensation. Aggressively capitalized software costs can keep current expenses out of the P&L while creating an asset that must be reviewed over time. One-time gains from selling an asset can flatter net income without improving recurring operations.
These aren't minor presentation quirks. They change decisions:
Practical test: For every encouraging P&L result, ask what changed in receivables, payables, inventory, debt, and bank cash.
The P&L remains essential. It just isn't a verdict delivered from a mountain. Read it beside the balance sheet and cash flow statement, then inspect recurring versus non-recurring revenue, customer concentration, seasonality, and the classification choices underneath the totals. A clean bottom line can still hide a messy business.
Consider a ten-person digital agency reviewing one month. It reports $180,000 in monthly revenue, with $42,000 in direct labor and software costs, $96,000 in operating expenses, $4,500 in interest expense, and a $6,000 tax provision.
Revenue comes first. Subtract direct labor and software costs, and gross profit is $138,000. That leaves the agency with a 76.7% gross margin, calculated as $138,000 divided by $180,000. The owner should use this line to decide whether client pricing covers the work required to deliver it.
Operating expenses include rent, salaries, and marketing. Subtract $96,000 from gross profit and operating income is $42,000. That's the core operating result before financing and tax. It informs the hiring decision: the agency has room in the operating model, but the owner still needs to inspect whether the result depends on one unusually large project.
Subtract interest expense of $4,500, then the tax provision of $6,000, and reported net income is $31,500. The accounting math works. The cash math may not.
| Line Item | Amount | Running Total | Decision It Informs |
|---|---|---|---|
| Revenue | $180,000 | $180,000 | Can the agency win enough work at current pricing? |
| Direct labor and software costs | ($42,000) | $138,000 gross profit | Does delivery pricing cover direct effort? |
| Operating expenses | ($96,000) | $42,000 operating income | Can overhead support another hire? |
| Interest expense | ($4,500) | $37,500 pre-tax income | Is debt adding too much drag? |
| Tax provision | ($6,000) | $31,500 net income | What remains after the reported period costs? |
The founder shouldn't treat $31,500 as cash available for distribution or expansion. Deferred client payments reduce actual cash movement, while prepaid annual software renewals consume cash before the related expense pattern fully appears in the monthly P&L. The report says the month was profitable. The bank account gives a narrower, less flattering answer.
That distinction should shape the next call. Take on a new client only if the delivery capacity and collection terms work. Delay a hire if receivables are stretching. Review pricing if gross profit looks healthy only because direct costs are classified elsewhere. For a practical process, use a guide on how to prepare an income statement, then reconcile the result to bank activity instead of admiring the bottom line in isolation.
Build a small review habit rather than waiting for a dramatic quarterly finance meeting. Once a week, pull the current-month P&L and look at three views: the current result, the same period from the prior year, and the approved budget. The point isn't to produce a ceremonial packet. It's to spot movement while you can still do something about it.
Log the three numbers that matter most for your model. For many operators, that means revenue, gross margin, and operating expenses. A services company may need to emphasize billable utilization and direct labor classification. A SaaS company may focus on subscription revenue, infrastructure costs, refunds, and channel spend. The right dashboard follows the economics, not somebody else's template.
Set a margin floor for each product or service line. If gross margin slips two points below target, trigger a pricing review or hiring freeze, as appropriate to the business. The threshold is a management rule, not a universal accounting law, so define it before the bad month arrives and everyone starts explaining why the decline is temporary.
Then inspect the causes, not just the variance:
A report that arrives late is not a management tool. Neither is a report built on stale reconciliations or inconsistent classifications. When the books drift, tax-aware modeling becomes necessary, or the team can't explain why profit isn't converting to cash, bring in a finance professional instead of guessing.
HireAccountants offers access to pre-vetted accountants and finance professionals for bookkeeping, reporting, financial analysis, and P&L support, with options for businesses that need full-time or part-time help. Visit HireAccountants to find finance support that can turn your monthly close into a decision-making system rather than a recurring late-night mystery.
Let's simplify your finances today!